A practical guide to ZBrain’s Monitor feature: Scope, key metrics, benefits and best practices
Listen to the article
AI solutions are transforming enterprise operations, driving automation, elevating customer experiences and enabling smarter decision-making across industries. As these AI systems become more autonomous and interconnected, real-time monitoring is no longer optional; it is essential for maintaining quality, reliability and business value.
Recent research highlights the urgency: An arXiv, Visibility into AI Agents, warns that a lack of transparency into agent activities and decision-making poses serious operational and governance risks. According to PwC’s 2024 AI Business Survey, only 11% of executives report having fully implemented fundamental responsible AI capabilities. Monitoring and auditing are highlighted as one of the most crucial categories for responsible AI, more than 80% of organizations indicate they are still progressing toward full implementation.
Security surveys indicate that the risk is escalating. SailPoint’s research found that while 98% of organizations plan to expand the use of AI agents, 96% view them as a growing security threat, and 54% specifically report risks related to the information accessed by AI agents. These gaps in observability and control are red flags signaling the need for real-time, agent-level monitoring.
ZBrain Monitor meets this need, enabling continuous, automated oversight of AI agents and applications. By combining advanced evaluation metrics with actionable insights, it empowers organizations to detect issues early and optimize AI performance at scale. This article provides an in-depth overview of AI agents and applications monitoring, with step-by-step guidance on implementing effective oversight using the ZBrain Monitor feature.
- Ensuring reliability: Monitoring AI agents and applications
- Key challenges addressed by AI monitoring
- Metrics used for monitoring AI agents and applications
- How ZBrain Monitor enables real-time oversight of AI agents and applications
- Comprehensive monitoring with ZBrain Monitor for apps and agents
- Best practices for monitoring AI agents and applications
- Key benefits of monitoring AI agents and applications with ZBrain Monitor
Ensuring reliability: Monitoring AI agents and applications
Building AI agents is a significant challenge, but simply deploying them is not enough to ensure consistent and reliable results in real-world settings. Once in production, AI agents and applications become part of dynamic, often unpredictable business environments. To maintain performance, prevent failures and continuously improve outcomes, organizations need robust monitoring, evaluation and observability practices.
AI agent and application monitoring is the ongoing process of observing and evaluating the real-world behavior, performance and impact of autonomous systems within an enterprise. It involves systematically tracking and analyzing agents’ inputs, outputs, resource usage (such as tokens and credits), response quality and operational health. It monitors each agent’s outcomes, success and failure trends, and cost metrics, providing end-to-end visibility into the behavior and performance of autonomous systems in production. It means capturing and analyzing signals such as logs and metrics that reflect how agents interact with data.
A new frontier in this field is large language model (LLM) observability. Unlike traditional software, which behaves deterministically, LLM-powered agents operate probabilistically and are highly context-dependent. This flexibility enables rich, adaptive behavior—but it also means outputs can vary, and unexpected results may surface. To manage this effectively, teams need LLM observability: the ability to monitor, trace, and understand how an agent produces its responses in real-world settings.
-
Track which contexts and actions led to specific responses
-
Debug and trace unexpected behaviors
-
Compare key metrics such as accuracy, latency and cost across different model versions in production
Comprehensive monitoring provides real-time visibility into the operational status and performance of AI agents and applications. Effective monitoring enables organizations to:
-
Confirm AI solution health: Verify that agents and applications are live, responsive and able to produce valid outputs through automated health checks.
-
Evaluate response quality: Continuously assess outputs using metrics such as response relevancy, faithfulness to context, exact match to reference answers and other configurable evaluation criteria.
-
Track success and failure trends: Monitor patterns of successful and failed responses to quickly identify recurring issues and breakdowns in agent and application workflows.
-
Drive operational insights: Analyze key operational metrics, including latency, token usage and resource costs, to inform ongoing optimization.
-
Support reliability: Detect abnormal behaviors, errors or unintended entity actions that could indicate failures.
-
Enable troubleshooting: Maintain detailed logs and query-level monitoring to support rapid root-cause analysis and continuous improvement cycles.
Simply put, AI monitoring transforms opaque, self-learning systems into accountable business assets, empowering organizations to maximize value while minimizing risk.
Streamline your operational workflows with ZBrain AI agents designed to address enterprise challenges.
Key challenges addressed by AI monitoring
As AI agents and applications take on increasingly critical roles in enterprise operations, robust, real-time monitoring has become essential for addressing a range of operational and strategic challenges.
Detecting silent failures
Monitoring enables organizations to catch responses that appear valid but are actually incorrect, irrelevant or low quality. With query-level visibility and configurable evaluation metrics, silent failures are identified early, preserving business accuracy and user trust. AI agents and applications may seem to perform as expected, yet silently deliver low-quality or inconsistent results.
Granular quality assessment
Monitoring allows every response to be automatically assessed against custom criteria for relevance, faithfulness and accuracy. This ensures that AI agents and applications consistently meet enterprise benchmarks for quality.
Framework diversity and integration overhead
AI solutions are built using a wide range of frameworks, each with distinct abstractions, control patterns and internal states. Achieving unified visibility often requires manual instrumentation (adding trace metadata, wrapping agent logic, custom logging), which is tedious, error-prone and can still miss key behaviors such as retries or fallbacks.
Fragmented view of agent workflows
In complex environments, agents interact with multiple tools, APIs or models. Without centralized monitoring, understanding the complete flow of data and decisions across these components is challenging, making root-cause analysis a time-consuming process.
Visualization gaps in traditional tools
Most observability dashboards are designed for linear, synchronous applications, not for the nonlinear, parallel and branching logic typical of agentic systems. This makes it difficult to reconstruct execution paths, trace agent decision-making or identify where and why failures occurred.
Enabling timely issue detection
With real-time alerts and thresholds, monitoring quickly surfaces performance bottlenecks, error spikes or sudden drops in accuracy. This supports rapid diagnosis and minimizes the impact on users and operations.
Vendor lock-in
Relying on monitoring tools that store logs and metrics in proprietary formats can trap organizations with a single vendor. If teams later need to switch providers or integrate with other platforms, migrating historical monitoring data becomes costly and technically challenging, directly limiting flexibility and slowing processes.
Integration complexity and technical debt
Monitoring AI agents and applications built on diverse frameworks often demands custom connectors and manual scripts for each environment. As systems evolve, maintaining these integrations increases support costs, slows development and compounds technical debt, raising the risk of operational failures.
By addressing these challenges, ZBrain’s monitoring enables AI agents and applications to transform from opaque, unpredictable systems into transparent, manageable and reliable enterprise assets.
Metrics used for monitoring AI agents and applications
Robust monitoring of AI agents and applications relies on a diverse set of metrics to evaluate response quality, operational health and alignment with business objectives. The ZBrain Monitor module supports a rich selection of evaluation metrics that fall into these primary categories:
-
LLM-based metrics
-
Non-LLM
-
Performance metrics
-
LLM-as-a-judge metrics
LLM-based metrics
LLM-based metrics evaluate the quality and relevance of agent and application responses using large language models. The metrics are specific to the Ragas library, which uses internal prompt templates and language models to perform automated evaluation. These are especially valuable when output quality cannot be reliably measured by simple string matching or basic logic. They capture the nuanced, semantic qualities of language and are particularly effective for open-ended, context-rich outputs.
Common LLM-based metrics include:
-
Response relevancy: Assesses how well the AI solution’s response addresses the user’s query. A higher score indicates a more relevant and contextually appropriate answer, supporting better user experiences and business outcomes.
-
Faithfulness: Evaluates whether the generated response accurately reflects the provided context, data or source information. High faithfulness scores indicate minimized hallucinations or unsupported statements, which is crucial for trustworthy AI in enterprise settings.
Example: For a customer support agent, LLM-based metrics help ensure that responses not only sound reasonable but are factually accurate and tailored to the actual customer question. They overcome the limitations of simple text matching by leveraging semantic understanding, making them more aligned with human judgment.
Non-LLM
Non-LLM-based metrics rely on deterministic, algorithmic comparisons, making them efficient and useful for scenarios where the expected output is known or tightly controlled. They are especially effective for structured outputs.
Common non-LLM-based metrics include:
-
Health check: Verifies if the agent or application is operational and capable of producing a valid response. If the health check fails, no further metrics are evaluated for that execution, helping teams quickly pinpoint systemic issues.
-
Exact match: Compares the agent’s response to an expected result for an exact, character-by-character match. Useful for deterministic tasks such as code generation, database lookups or standardized answers.
-
F1 score: Balances precision and recall, measuring coverage of relevant information and avoidance of omissions. Commonly used for classification and extraction tasks.
-
Levenshtein similarity: Calculates the minimal number of single-character edits needed to change one string into another, providing a measure of similarity.
-
ROUGE-L score: Evaluates similarity by identifying the longest common subsequence of words, commonly used in summarization.
Example: For document automation or data extraction agents, these metrics ensure outputs match ground truth records with high accuracy and reliability. They are fast, objective and valuable for rule-based validation.
Performance metrics
Performance metrics in ZBrain Monitor focus on the efficiency of agent execution. Currently, the supported performance metric is response latency.
-
Response latency: Measures the total time (in milliseconds) taken by the LLM to return a response after receiving a query. This helps teams track responsiveness and ensures agents meet required production speeds. Users can configure thresholds in seconds or minutes. When a threshold is breached or achieved, the system automatically triggers Success or Failure responses and sends notifications.
Example: For real-time support bots, response latency ensures outputs are delivered quickly enough to maintain smooth user experiences.
LLM-as-a-judge metrics
LLM-as-a-judge metrics simulate human-like evaluation by using an LLM to judge qualitative aspects of a response. This approach provides a scalable, consistent and cost-effective alternative to human review.
Common metrics include:
-
Creativity: Rates originality and imagination in the response, useful for generative content or brainstorming.
-
Helpfulness: Measures how well the response guides or supports the user in resolving a question or problem.
-
Clarity: Assesses whether the message is clearly communicated and easily understood.
Example: For executive summary generators or creative writing assistants, these metrics ensure outputs are accurate, engaging and easy to understand.
Why use multiple metrics?
Combining multiple metrics creates composite and reliable evaluation rules. By leveraging LLM-based, non-LLM-based, performance and LLM-as-a-judge metrics, organizations gain a comprehensive view of operational health, output quality and user experience.
LLM-based metrics bring semantic intelligence, non-LLM-based metrics ensure objective comparability, performance metrics validate responsiveness and efficiency, and LLM-as-a-judge provides scalable, human-like evaluation. By combining these, the ZBrain Monitor module offers end-to-end visibility, allowing enterprises to:
This approach enables enterprises to:
-
Detect subtle, context-specific errors invisible to simple algorithms
-
Quantify output quality across diverse use cases and formats
-
Benchmark model performance over time and across versions
-
Automate routine evaluation while reserving human review for high-impact issues
With configurable evaluation conditions and flexible metric selection, modern monitoring empowers enterprises to maintain the highest standards of accuracy, reliability and user satisfaction across all ZBrain AI agents and applications.
How ZBrain Monitor enables real-time oversight of AI agents and applications
For enterprises relying on AI solutions, maintaining high standards of reliability, quality and compliance is non-negotiable. The ZBrain Monitor module is purpose-built for this challenge, empowering teams to automate granular evaluation and performance tracking across all AI agents and applications.
The ZBrain Monitor module delivers end-to-end visibility and control of AI agents and applications by automating both evaluation and performance tracking. With real-time tracking, ZBrain Monitor ensures response quality by continuously monitoring for emerging issues based on configured evaluation criteria. This enables users to configure real-time alerts, ensuring they are notified of critical events and can maintain optimal performance across deployed solutions.
Monitor captures inputs and outputs from AI solutions and continuously evaluates responses against defined metrics at scheduled intervals. This process delivers real-time insights into operational performance, tracking both success and failure status while highlighting trends that require attention. All results are presented in an intuitive interface, enabling rapid identification and resolution of issues to ensure consistent, high-quality AI interactions across the enterprise.
Key capabilities of ZBrain Monitor
-
Automated evaluation: Leverage flexible evaluation approaches with LLM-based, non-LLM-based, performance and LLM-as-a-judge metrics. This enables scenario-specific monitoring tailored to enterprise use cases.
-
Performance tracking: Identify trends in agent and application performance through visual logs and comprehensive reports.
-
Query-level monitoring: Configure evaluations at the individual query level within each session. This granular approach provides precise oversight of agent and application behaviors and outputs.
-
Agent and application support: Achieve end-to-end visibility by monitoring both AI agents and AI applications across the enterprise landscape.
-
Input flexibility: Evaluate responses across a wide range of formats, ensuring broad applicability across diverse workflows.
-
Notification alerts: Enable real-time notifications to receive event status updates via multiple channels or email.
ZBrain Monitor interface: Main modules
The Monitor module includes these main sections, accessible from the left navigation panel:
- Events: View and manage all configured monitoring events in a centralized list.
- Monitor logs: Review detailed execution results and evaluation metrics, making it simple to trace, audit, and troubleshoot.
- Event settings: Configure evaluation metrics, thresholds, and notification parameters for each event, enabling tailored monitoring strategies.
- User management: ZBrain Monitor supports role-based user permissions. Administrators can assign access and management rights to specific users, including Builders and Operators, ensuring secure and controlled oversight of monitoring activities.
By automating the monitoring process and surfacing actionable insights in real time, ZBrain Monitor enables teams to maintain continuous, high-quality AI operations, achieve faster issue resolution, and drive ongoing performance improvements.
Comprehensive monitoring with ZBrain Monitor for apps and agents
ZBrain Monitor equips enterprises with the tools to ensure AI applications and agents perform consistently, meet quality standards and align with business objectives. It consolidates monitoring into a single module where teams can define evaluation criteria, track performance and receive real-time alerts.
Monitor event settings
The Event Settings module allows teams to define what inputs and outputs to monitor and how frequently evaluations should run – from every 30 minutes to weekly.
ZBrain Builder supports a broad set of metrics. Multiple metrics can be combined using AND/OR logic, and thresholds can be set to determine pass or fail outcomes. This flexibility ensures monitoring conditions reflect real business needs, whether accuracy, relevance or performance speed is the priority.
|
Metric category |
Metric name |
Purpose |
Example |
|---|---|---|---|
|
LLM-based metrics |
Response relevancy |
Checks how well the response answers the user’s question. Higher scores indicate better alignment with the query. |
Use for FAQ bots or chat assistants to validate on-topic answers. |
|
|
Faithfulness |
Measures whether the response accurately reflects the given context, minimizing hallucinations or incorrect information. |
Essential for RAG or context-driven LLM apps to prevent factual errors. |
|
Non-LLM metrics |
Health check |
Determines if the app/agent is operational and capable of producing a valid response; further checks halt on failure. |
Run at the start of every app/agent execution for operational monitoring. |
|
|
Exact match |
Compares the app’s or agent’s response to the expected output for an exact character-by-character match. |
Use for deterministic output tasks (e.g., structured data extraction). |
|
|
F1 score |
Balances precision and recall to assess how well the response captures the expected content. |
Useful in QA, classification, or multi-label tasks with expected answers. |
|
|
Levenshtein similarity |
Calculates how closely two strings match, based on the number of edits needed to transform one into the other. |
Detects typos or near-matches in text or code outputs. |
|
|
ROUGE-L score |
Evaluates similarity by identifying the longest common sequence of words between the generated and reference text. |
Effective for summarization and paraphrase evaluation. |
|
Performance metrics |
Response latency |
Measures the total time (in milliseconds) taken by the LLM to return a response after receiving a query. |
Monitor real-time support bots to ensure fast, production-grade outputs. |
|
LLM-as-a-judge metrics |
Creativity |
Rates how original and imaginative the response is in addressing the prompt. |
Use for brainstorming, content generation, or marketing copy. |
|
|
Helpfulness |
Assesses how well the response guides or supports the user in resolving their query. |
Evaluate customer support or advisory agent responses. |
|
|
Clarity |
Measures how easy the response is to understand and how clearly it communicates the intended message. |
Review for user-facing documentation or explanations. |
A central part of Event Settings is threshold configuration. Thresholds act as cut-off values that determine whether a response meets expectations.
Within Event Settings, teams can use the Test Evaluation Settings panel to validate monitoring configurations before deploying them in production. In addition to relying on system-generated outputs, evaluators can provide custom test inputs to simulate realistic or edge-case scenarios.
This flexibility ensures monitoring reflects not just generic outputs, but also the specific queries, compliance checks or failure cases that matter most to the business. It helps teams fine-tune thresholds, reduce false positives and confirm metric accuracy under controlled conditions – strengthening quality assurance before production rollout.
Finally, notifications can be configured directly from Event Settings so alerts are triggered when evaluations meet the defined conditions – success or failure. Multiple notification flows (Slack, Microsoft Teams, Gmail, etc.) can be configured, ensuring the right teams are notified in real time through their preferred channels.
Monitor Logs: Visibility and accountability
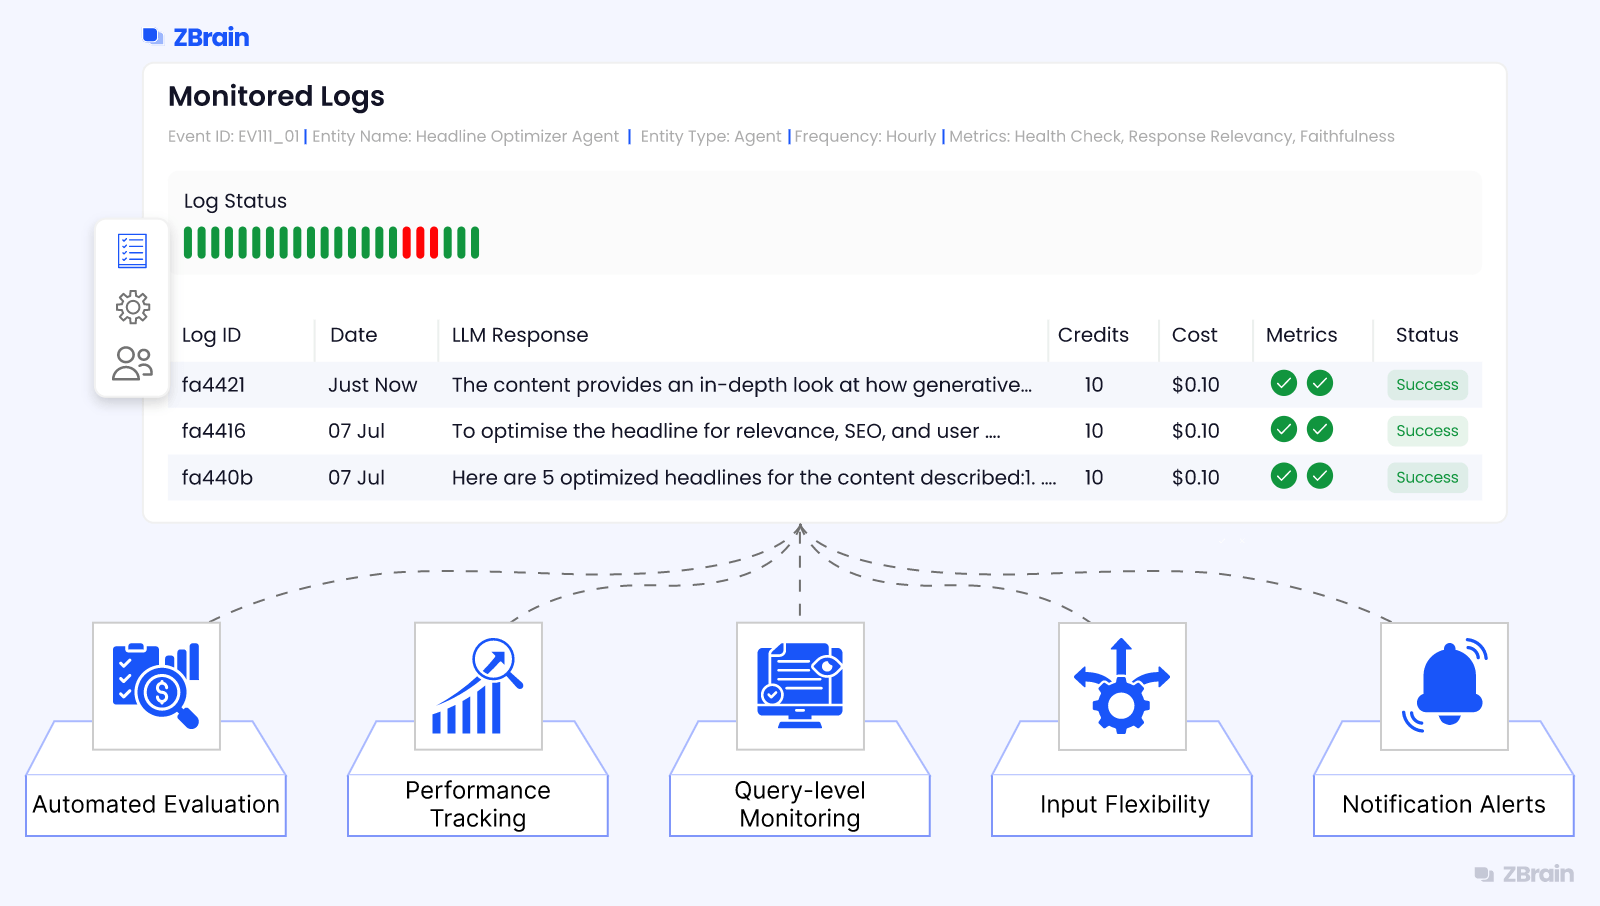
Once monitoring is enabled, ZBrain Builder automatically records every evaluation run in Monitor Logs. These logs provide teams an intuitive, structured view of system performance over time.
Each log captures the outcome of evaluations, the metrics applied and how often monitoring is performed. Results are displayed using color-coded visual indicators – green for success, red for failure – so patterns and anomalies can be spotted at a glance. Flexible filters allow teams to focus on specific periods or outcomes, keeping analysis efficient and targeted.
Each log entry includes:
-
Event and log IDs for traceability.
-
Execution metadata such as model used, token usage, credits consumed, etc.
-
Generated LLM responses.
-
Color-coded bars to visualize success (green) or failure (red) over time.
Detailed monitor logs help teams with:
-
Instant status visualization: Color-coded indicators make it easy to identify patterns and spot anomalies at a glance.
-
Trend discovery: Aggregated status bars highlight recurring issues or improvements, helping teams understand problem patterns.
-
Focused analysis: Flexible filters by status and date allow users to drill into the most relevant runs without sifting through unnecessary detail.
-
Context for troubleshooting: Each log consolidates essential information about what was evaluated, how it performed against metrics and whether it passed or failed. This helps teams move quickly from detection to diagnosis.
-
Enterprise-grade accountability: Monitor Logs create a transparent audit trail, critical for compliance reviews, stakeholder reporting and continuous improvement programs. By making agent and app behavior visible and explainable, they help enterprises maintain trust in AI operations.
Monitor Logs turn raw monitoring data into actionable insights. By combining clear visualization, traceability and diagnostic context, they give enterprises the confidence to operate AI systems transparently, spot issues early and continuously improve performance.
User management: Controlled access to monitoring
ZBrain Monitor includes a user management module that brings governance and accountability to monitoring. Instead of open access, admins can control who can view, configure and manage monitoring events, ensuring that only the right teams handle sensitive evaluation data.
Within the User Management tab, admins can assign permissions in two ways:
-
Custom access – Specific builders or users are invited to manage the event. A builder is a user who can add, update or operate ZBrain knowledge bases, apps, flows and agents. This option ensures monitoring for critical agents or apps stays restricted to designated owners.
-
Everyone access – The event is visible and manageable by all builders, enabling open collaboration on shared monitoring initiatives.
By tailoring access, enterprises can:
-
Strengthen governance – Restrict sensitive monitoring rules and thresholds to authorized users only.
-
Enable accountability – Track which assigned users are responsible for managing monitoring events, supporting auditability and compliance.
-
Balance control and collaboration – Enforce strict ownership where required (e.g., compliance-heavy apps) while allowing broad collaboration in lower-risk scenarios.
This role-based approach ensures monitoring remains secure, accountable and collaborative, giving enterprises confidence that oversight is applied at the right level.
By using ZBrain Monitor, enterprises ensure their AI solutions consistently meet defined standards for accuracy, performance and business value.
Streamline your operational workflows with ZBrain AI agents designed to address enterprise challenges.
Best practices for monitoring AI agents and applications
Robust monitoring is essential for ensuring the accuracy, quality, and compliance of both AI agents and applications at scale. By leveraging ZBrain Monitor’s full capabilities, organizations can implement the following best practices to maximize oversight and drive continuous improvement:
Align monitoring to business outcomes
- Define success criteria: Specify what constitutes “success” for each AI app and agent—whether it’s task accuracy, user satisfaction, compliance, or operational efficiency. When defining success criteria, use SMART(Specific, Measurable, Achievable, Relevant, Time-bound) goals to ensure each metric and KPI is actionable, relevant, and time-bound. For example, a customer support agent’s response time goal might be to reduce average response latency by 20% within a quarter.
- Map metrics to business impact: Select evaluation metrics (LLM-based, non-LLM-based, and LLM-as-a-judge) that reflect both technical and business priorities for each monitored entity.
Utilize multi-layered metrics and establish baselines
- Comprehensive metric coverage: Monitor a range of metrics (quality, latency, cost etc.) for all apps and agents, providing a holistic view of entity behavior. Move beyond single-metric (LLM-based or non-LLM based) evaluation by employing composite or multi-objective metrics, ensuring agents and apps are assessed on quality, speed, and cost.
- Baseline comparisons: Regularly compare performance data against historical benchmarks or defined targets to identify improvements, degradations, or anomalies.
Set and tune effective thresholds
- Context-aware thresholds: Start with conservative thresholds and refine them based on real-world usage and the risk profile of each application or agent.
- Criticality-based segmentation: Set more stringent thresholds (e.g., higher accuracy) for business-critical or customer-facing apps and agents. For internal or less critical use cases, thresholds can be adjusted as needed to strike a balance between resource usage and business risk.
Continuously refine metrics and thresholds
- Iterative improvement: Revisit your metrics and thresholds regularly, especially after major product updates, scaling events, or as your understanding of business impact matures.
- Stakeholder feedback: Incorporate input from both technical and business teams to ensure metrics remain aligned with operational and strategic goals.
Blend automated and human-in-the-loop evaluation
- Human oversight for subjective criteria: Supplement automated metrics with regular human review, particularly for subjective factors such as clarity, tone, or regulatory risk.
- User feedback integration: Collect and utilize user feedback on both apps and agents to continuously improve outcomes.
Drive iterative improvement through regular review
- Periodic data reviews: Establish a schedule for reviewing monitoring results and updating evaluation strategies.
- Evolve metrics and policies: Add or revise metrics as business needs and AI system roles evolve; adjust thresholds based on observed trends.
Maintain comprehensive monitoring documentation
- Policy documentation: Maintain detailed records that outline what is monitored, which metrics are tracked, how those metrics are calculated, and the rationale behind the selected thresholds.
- Response playbooks: Document escalation paths, notification recipients, and clear, actionable steps for responding to different types of incidents or alerts.
- Regular reviews: Periodically update documentation to reflect system changes, new regulatory requirements, or evolving business needs.
Track credits and cost transparency
- Monitor credit usage: Ensure that every execution for a monitoring event, whether by an AI agent or application, logs the exact number of credits consumed. Tracking credit consumption at the session and query level helps organizations understand usage patterns and optimize allocation.
- Enable cost visibility: Provide real-time visibility into the cost associated with each monitored event. Make it easy for stakeholders to view cost breakdowns, both per query and in aggregate, directly from the monitoring interface.
- Set budget and usage alerts: Implement thresholds or automated alerts for credit usage and overall spending. E.g., ZBrain Monitor can support automated alerts for cost-specific metrics. Notify teams proactively if usage approaches or exceeds predefined limits to prevent cost overruns.
Foster a monitoring-first culture
- Training: Educate teams on the importance of monitoring, how to interpret metrics, and the process for responding to alerts.
- Transparency: Make monitoring dashboards, alert histories, and performance reports available to all relevant stakeholders.
- Accountability: Assign clear ownership for each monitored entity and for maintaining the health of the monitoring infrastructure itself.
Key benefits of monitoring AI agents and applications with ZBrain Monitor
Effective monitoring is not just about compliance or operational health; it unlocks business value across multiple dimensions. Here’s how ZBrain Monitor delivers measurable benefits:
Actionable performance insights
ZBrain Monitor provides real-time visibility into agent and application performance through metrics such as response relevance, faithfulness and health checks. For example, if an agent’s relevance score drops below a set threshold, teams can immediately investigate and address the issue before it affects downstream workflows or business outcomes.
Faster troubleshooting and root-cause analysis
Granular, query-level monitoring enables teams to quickly pinpoint the cause of errors or suboptimal performance, reducing investigation time and accelerating resolution.
Stronger alignment with business objectives
By aligning monitoring metrics with business KPIs, organizations ensure that their AI systems remain focused on delivering measurable value, whether it is operational efficiency, risk reduction or enhanced customer experience.
Enhanced debugging and troubleshooting
By logging detailed execution traces, including inputs, outputs and metric outcomes, ZBrain Monitor makes it simple to isolate root causes. For example, if an agent’s F1 score or Levenshtein similarity consistently falls short for specific input types (such as PDF files), teams can review logs, replicate scenarios and roll out targeted fixes.
Elevated user experience
Monitoring satisfaction and relevance metrics helps product owners identify when AI-generated responses become less helpful or clear, triggering timely improvements. In customer-facing scenarios, maintaining high clarity and helpfulness scores ensures continued trust and engagement.
Greater agility and innovation
With visibility into performance and the ability to iterate quickly, product teams can launch, test and refine new AI-powered features with greater confidence. Early detection of issues accelerates feedback cycles, reducing the risk and cost of failed experiments.
Improved customer trust and retention
Consistent, high-quality AI interactions lead to enhanced end-user experiences. When customers see that applications deliver reliable, accurate and timely responses, their trust and loyalty increase, directly impacting retention and revenue.
With ZBrain Monitor, organizations achieve real-time, automated oversight that drives higher performance, faster innovation and ongoing business value from every AI solution deployment.
Endnote
As AI agents and applications rapidly reshape enterprise operations, robust monitoring is not just a technical necessity; it is a driver of business resilience and competitive edge. ZBrain’s monitoring module empowers organizations to move beyond surface-level oversight, delivering automated, granular, and actionable intelligence for every AI agent and application. By enabling real-time performance tracking, accelerating root-cause resolution, and aligning AI outcomes with business KPIs, ZBrain transforms AI from an experimental tool into a reliable, scalable business asset. In today’s landscape, embracing advanced monitoring is essential to unlock the full value and longevity of your AI investments.
Ready to unlock the full potential of AI agents and applications? Explore the ZBrain Builder to build, deploy, and continuously monitor enterprise-grade AI solutions with seamless integration, real-time visibility, and actionable insights at every step.
Listen to the article
Author’s Bio

An early adopter of emerging technologies, Akash leads innovation in AI, driving transformative solutions that enhance business operations. With his entrepreneurial spirit, technical acumen and passion for AI, Akash continues to explore new horizons, empowering businesses with solutions that enable seamless automation, intelligent decision-making, and next-generation digital experiences.
Table of content
- Ensuring reliability: Monitoring AI agents and applications
- Key challenges addressed by AI monitoring
- Metrics used for monitoring AI agents and applications
- How ZBrain Monitor enables real-time oversight of AI agents and applications
- Comprehensive monitoring with ZBrain Monitor for apps and agents
- Best practices for monitoring AI agents and applications
- Key benefits of monitoring AI agents and applications with ZBrain Monitor
Frequently Asked Questions
What is AI agent/application monitoring, and why is it critical for enterprises?
AI agent and application monitoring is the systematic process of tracking, evaluating, and analyzing the real-time behavior, responses, and performance of AI-powered systems in production. Unlike basic uptime monitoring, it includes a granular evaluation of response quality, operational health, compliance, and cost efficiency.
For enterprises, this practice is crucial because AI agents and applications frequently manage complex, business-critical workflows that demand both trustworthiness and transparency. Proactive monitoring enables the early detection of errors, operational bottlenecks, and compliance risks, while facilitating continuous optimization and accountability for business outcomes.
How does monitoring AI agents and apps differ from traditional software monitoring?
Traditional software monitoring typically focuses on server uptime, error logs, and static rules. In contrast, AI agents and applications are dynamic; they learn, adapt, and make probabilistic decisions. Monitoring these systems requires advanced metrics (e.g., relevance, faithfulness, clarity) and traceability of decisions, not just technical “health.”
AI monitoring must capture the full lifecycle of inputs, model reasoning, and outputs, as well as costs, tokens used and latency. This level of observability is essential for debugging, compliance, and iterative improvement.
What challenges does AI agent and application monitoring address?
AI agent and application monitoring help solve these core challenges:
-
Silent failures: Detects errors or inaccuracies that are not visible through surface-level checks.
-
Quality assurance: Assesses every response for accuracy, faithfulness, and relevance to context.
-
Operational bottlenecks: Quickly identifies latency spikes, token overuse, or resource inefficiencies.
-
Security and compliance: Surfaces abnormal behaviors and access patterns for audit readiness.
-
Root cause analysis: Supports deep-dive troubleshooting with query-level logs and metrics.
-
Cost control: Monitors credit usage in real-time.
How does ZBrain's Monitor feature work?
ZBrain Monitor is a module within the ZBrain Builder platform designed for continuous, automated monitoring of AI agents and applications. It works by capturing every input and output from monitored systems, then evaluating results against configurable, business-aligned metrics. Its interface presents real-time performance, success/failure rates, credits usage, and cost data, providing complete visibility for optimization and compliance. It allows teams to track, audit, and optimize performance using configurable metrics, query-level analysis, and automated alerts, ensuring AI systems remain reliable, compliant, and aligned with business goals.
What metrics does ZBrain Monitor use to evaluate AI agent and app performance?
ZBrain Monitor offers a robust, continuously expanding set of evaluation metrics across three main categories:
1. LLM-based metrics
The LLM-based metrics are specific to the Ragas library, which uses internal prompt templates and language models to perform automated evaluation. These are ideal for open-ended or context-rich tasks.
-
Response relevancy: How well the response addresses the user’s question.
-
Faithfulness: Whether the response accurately reflects the given context.
2. Non-LLM metrics
Fast, objective metrics best for scenarios with defined outputs or ground truth.
-
Health check: Confirms if the agent or app is operational and producing valid outputs.
-
Exact match: Tests for an exact, character-by-character match with the expected output.
-
F1 score: Balances precision and recall to assess output accuracy.
-
Levenshtein similarity: Calculates how closely the output matches the reference.
-
ROUGE-L score: Assesses similarity based on the longest shared sequence of words.
3. Performance metrics
Performance metrics focus on the efficiency of agent execution.
-
Response latency: Measures the total time (in milliseconds) taken by the LLM to return a response after receiving a query.
4. LLM-as-a-judge metrics
Use an LLM to simulate human evaluation of subjective qualities.
-
Creativity: Rates the originality of the agent’s response.
-
Helpfulness: Evaluates how much the response aids or guides the user.
-
Clarity: Scores how clear and understandable the response is.
Can monitoring be customized for different use cases and business priorities?
Yes, ZBrain Monitor offers extensive customization to suit different use cases and business priorities. Users can select the most relevant metrics for each agent or application, set custom evaluation frequencies such as hourly or daily, and define tailored threshold values based on industry standards or the criticality of the business process. Notification flows can be configured to alert the right stakeholders, and role-based permissions ensure secure and collaborative monitoring. This high degree of configurability enables organizations to tailor their monitoring setup to specific objectives, whether that involves prioritizing regulatory compliance in finance, optimizing precision in supply chains, or focusing on cost efficiency in customer support.
What are the business benefits of using ZBrain Monitor for tracking AI agents and applications?
ZBrain Monitor enables organizations to detect issues early, achieve end-to-end operational transparency, enhance user experience, manage costs effectively, and ensure regulatory compliance. Its real-time insights accelerate innovation and strengthen customer trust.
-
Proactive issue detection: Automatically evaluate app performance at configured intervals and notify users of any errors based on predefined conditions, enabling timely resolution before they impact end users or operations.
-
Operational transparency: Gain end-to-end visibility into agent outcomes.
-
Improved user experience: Maintain high satisfaction, clarity, and relevance scores across customer-facing solutions.
-
Cost management: Track and control credit usage to ensure predictable AI operating expenses.
-
Accelerated innovation: Confidently deploy and iterate on AI solutions with real-time feedback loops.
-
Stronger trust and retention: Reliable AI performance builds stakeholder and customer confidence.
How can organizations get started with building and deploying AI agents and applications using ZBrain Builder?
To begin your AI journey with ZBrain:
-
Contact us at hello@zbrain.ai
-
Or fill out the inquiry form on zbrain.ai
Whether you have a clear scope or just an idea, our team will guide you from strategy to execution.
Insights

Common solution architecture design challenges — and how to overcome them
Solution architecture must evolve from fragmented documentation practices to a structured, collaborative, and continuously validated design capability.
Why structured architecture design is the foundation of scalable enterprise systems
Structured architecture design guides enterprises from requirements to build-ready blueprints. Learn key principles, scalability gains, and TechBrain’s approach.
A guide to intranet search engine
Effective intranet search is a cornerstone of the modern digital workplace, enabling employees to find trusted information quickly and work with greater confidence.
Enterprise knowledge management guide
Enterprise knowledge management enables organizations to capture, organize, and activate knowledge across systems, teams, and workflows—ensuring the right information reaches the right people at the right time.
Company knowledge base: Why it matters and how it is evolving
A centralized company knowledge base is no longer a “nice-to-have” – it’s essential infrastructure. A knowledge base serves as a single source of truth: a unified repository where documentation, FAQs, manuals, project notes, institutional knowledge, and expert insights can reside and be easily accessed.
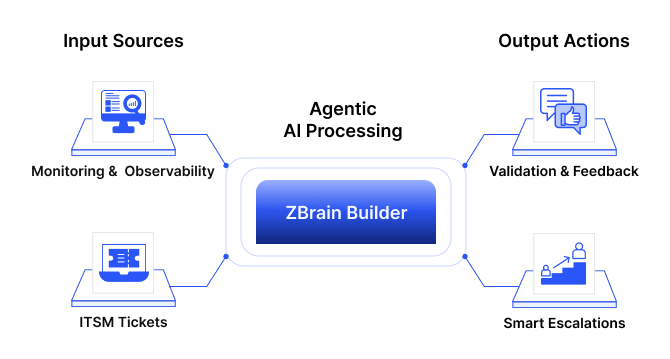
How agentic AI and intelligent ITSM are redefining IT operations management
Agentic AI marks the next major evolution in enterprise automation, moving beyond systems that merely respond to commands toward AI that can perceive, reason, act and improve autonomously.
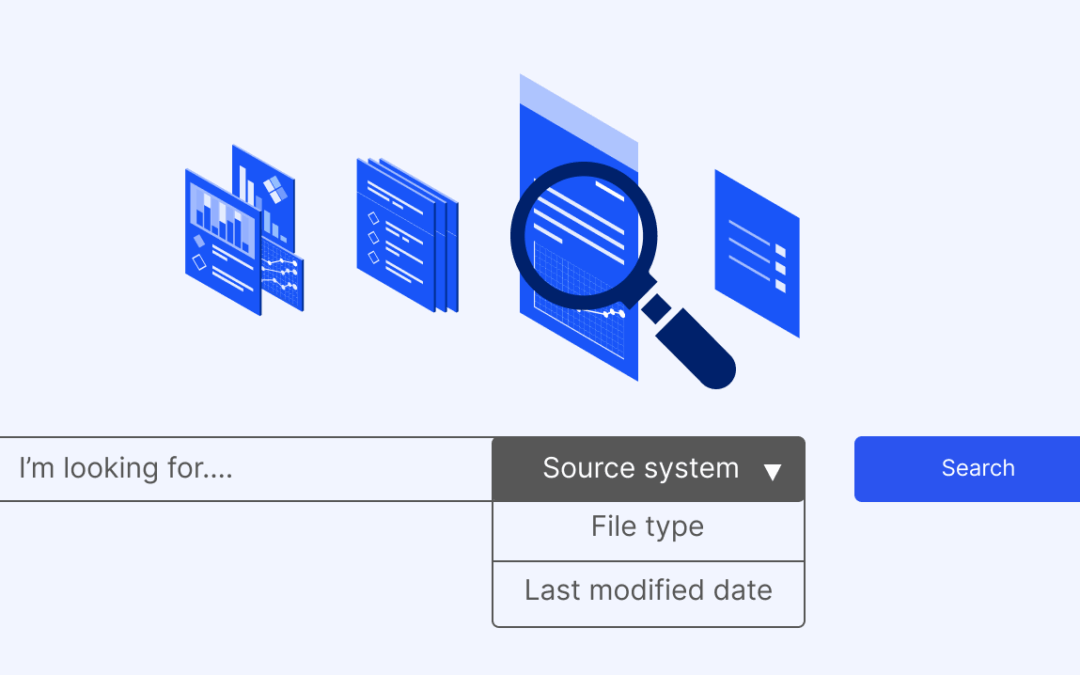
What is an enterprise search engine? A guide to AI-powered information access
An enterprise search engine is a specialized software that enables users to securely search and retrieve information from across an organization’s internal data sources and systems.
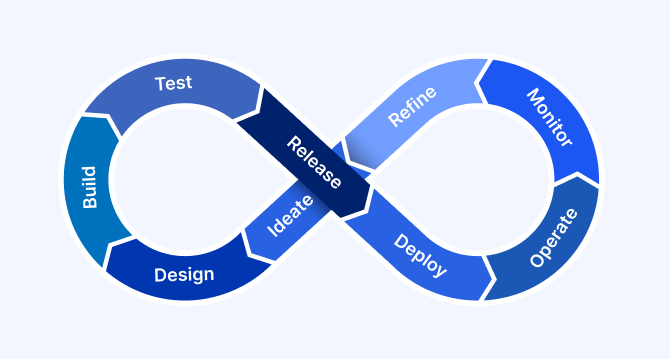
A comprehensive guide to AgentOps: Scope, core practices, key challenges, trends, and ZBrain implementation
AgentOps (agent operations) is the emerging discipline that defines how organizations build, observe and manage the lifecycle of autonomous AI agents.
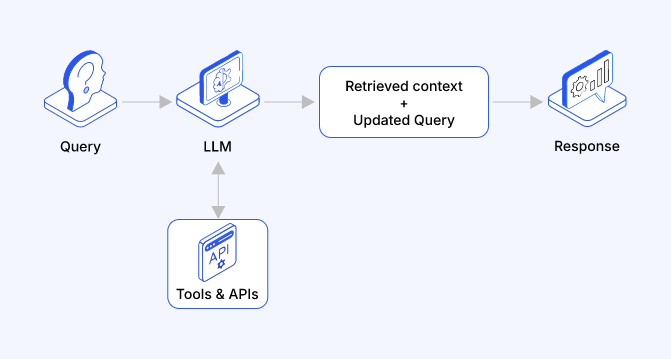
Adaptive RAG in ZBrain: Architecting intelligent, context-aware retrieval for agentic AI
Adaptive Retrieval-Augmented Generation refers to a class of techniques and systems that dynamically decide whether or not to retrieve external information for a given query.


