AI agent monitoring: Key metrics, best practices, benefits, challenges and future trends

Listen to the article
AI agents are moving from experimentation to execution—rapidly becoming embedded in core business operations. Unlike traditional software systems, these autonomous agents do not simply follow predefined logic; they reason, make decisions, interact with tools, and adapt dynamically to changing inputs. This shift toward agentic AI marks a structural change in how work gets done across the enterprise.
The momentum is clear. The global AI agents market is expected to rise from USD 15 billion in 2026 to USD 221 billion by 2035, representing a higher CAGR of 34.64% during the forecast period.
AI agents are no longer peripheral—they are becoming central to how organizations operate and scale.
Yet a critical gap is emerging.
While organizations are rapidly deploying AI agents, many lack the systems required to monitor and manage them effectively in production. Unlike traditional applications, AI agents are inherently non-deterministic—their outputs vary based on context, data quality, and execution patterns. As a result, failures are rarely explicit. Agents do not simply break; they drift, hallucinate, misinterpret instructions, or degrade silently over time.
This creates new operational risks.
85% of IT leaders report challenges integrating AI into existing systems, while 76% cite data security and privacy concerns. At the same time, trust remains fragile—70% of consumers demand transparency in AI-driven decisions, yet only 39% express strong trust in AI systems.
The implication is clear: deploying AI agents is no longer the hard part—managing them is.
This shift has led to the emergence of new operational approaches, including AgentOps, focused on managing AI systems across their lifecycle. Within this, AI agent monitoring plays a critical role—enabling organizations to track behavior, evaluate outcomes, and ensure consistent performance in real-world environments.
As AI systems become more autonomous, monitoring is no longer optional—it is foundational to building reliable, scalable, and trustworthy AI operations.
In this article, we explore the essential metrics for evaluating agentic performance, effective monitoring strategies, and how the ZBrain Builder’s Monitor module provides the visibility needed to transform autonomous agents into reliable enterprise assets.
- Understanding the difference: Monitoring, evaluation, and observability
- Why is monitoring AI agents essential?
- Potential challenges and blind spots in AI agent monitoring
- Understanding how AI agent monitoring works
- Best practices for monitoring AI agents
- Exploring ZBrain Builder metrics for agent monitoring
- Post-deployment monitoring and effective management of ZBrain AI agents
- Introducing ZBrain Monitor Module for comprehensive oversight
- Key benefits of monitoring AI agents
- The future of AI agent monitoring: Key trends and enhancements
Understanding the difference: Monitoring, evaluation, and observability
As organizations adopt AI agents at scale, it becomes important to distinguish between related concepts such as monitoring, evaluation, and observability—each playing a different role in managing agentic systems effectively. These distinctions are critical for designing effective monitoring strategies and avoiding gaps in performance visibility.
AI agent monitoring
Monitoring focuses on continuously tracking agent performance and behavior in production environments. It involves tracing key signals such as latency, task status, token usage, cost, and overall performance trends.
It answers questions like:
-
Is the agent performing reliably?
-
Are tasks completing successfully?
-
Are there any signs of performance degradation or inefficiencies?
Evaluation
Evaluation focuses on measuring the quality and effectiveness of agent outputs against defined criteria. This may include assessing relevance, correctness, or usefulness using structured scoring, feedback signals, or predefined benchmarks.
It answers questions like:
-
Is the agent producing useful and accurate outputs?
-
Is it meeting task expectations?
-
How well does it perform across different scenarios?
AI agent observability
Observability refers to the broader ability to gain deeper insight into how a system operates internally. In AI systems, this may include understanding execution flows, interactions, and behavior across different stages.
While observability provides additional depth, most enterprise implementations rely primarily on monitoring and structured evaluation to manage performance and reliability at scale.
How do these work together
In practice, these capabilities complement each other:
-
Monitoring provides continuous visibility into performance and system health
-
Evaluation measures output quality and effectiveness
-
Observability offers deeper diagnostic insight where needed
Together, they help organizations move from simply running AI agents to operating them reliably, efficiently, and at scale.
Streamline your operational workflows with ZBrain AI agents designed to address enterprise challenges.
Why is monitoring AI agents essential?
As AI agents move from experimentation to execution, monitoring becomes a foundational capability—not a post-deployment add-on. Unlike traditional systems, AI agents operate through dynamic reasoning, tool interactions, and probabilistic outputs, making their behavior inherently less predictable and harder to control.
AI agent monitoring is the practice of continuously observing agent behavior, decision pathways, and outcomes in real-world environments to ensure reliability, safety, and business alignment. Without it, organizations risk deploying systems that appear functional on the surface but fail silently in production.
Performance variability management: AI agents are highly responsive to input complexity, exhibiting dynamic and non-deterministic behavior that adapts to varying contexts, prompts, and retrieved data. Unlike traditional software, the same input may yield different outputs depending on the execution flow, intermediate steps, or interactions with external tools. This makes it essential to continuously monitor not just final outputs, but also variations in response patterns, reasoning consistency, and execution efficiency. Establishing performance baselines helps detect anomalies such as inconsistent outputs, inefficient reasoning loops, or unexpected deviations, enabling continuous optimization over time.
Explainability and transparency: Monitoring provides visibility into how AI agents arrive at outcomes by capturing execution flow, outputs, and session-level activity. This is essential for regulatory compliance, auditability, and building stakeholder trust—especially in high-stakes domains. It also enables teams to diagnose inconsistencies and validate system behavior more effectively.
Detection of subtle degradation: AI agent performance can degrade gradually and often without explicit failure signals. Agents relying on retrieval pipelines, long context windows, or external tools may experience silent degradation due to embedding drift, retrieval quality decline, prompt regressions, or tool/API inconsistencies. Continuous monitoring enables early detection of these issues by tracking shifts in output quality, execution patterns, and task success rates—preventing small degradations from compounding into significant operational failures.
Multidimensional success evaluation: AI systems require complex, multifaceted evaluation metrics beyond traditional software measurements. Effective monitoring approaches track these diverse metrics, from accuracy and speed to problem-solving capabilities and customer satisfaction scores.
Business value validation: Monitoring provides concrete data to justify ongoing AI investments by demonstrating measurable business impact. By tracking metrics such as task completion, processing time, token usage, and associated costs, organizations can assess the efficiency and impact of AI deployments. For SMBs, properly monitored AI implementations can substantially reduce costs while maintaining or improving service quality. Monitoring helps link agent output to KPIs such as cost savings, resolution time or lead conversion.
Quality control and customer experience: For customer-facing AI applications, monitoring ensures that interactions meet quality standards, thereby enhancing customer satisfaction. Tracking response accuracy, consistency, and user feedback helps identify areas where agents may fall short. Tracking metrics such as response accuracy and problem-solving success rates helps refine AI agents’ behaviors based on user interactions.
Operational optimization: Comprehensive monitoring identifies bottlenecks, inefficiencies and opportunities for improvement in AI agent deployment, allowing organizations to maximize operational benefits. By analyzing session duration, task completion patterns, and queue or execution delays, teams can identify bottlenecks and optimize workflows.
Human-AI collaboration metrics: In enterprise environments, AI agents often operate alongside human users. Monitoring helps evaluate the effectiveness of these interactions by tracking user feedback, task outcomes, and intervention points. These insights support better coordination between AI systems and human teams, ensuring smoother workflows and improved productivity.
Cost and resource utilization efficiency: AI agents operate on usage-based cost models, making it essential to monitor token consumption and associated costs. By tracking these metrics at both aggregate and session levels, organizations can optimize resource utilization, control operational expenses, and make informed decisions about scaling AI deployments.
Why is monitoring AI agents essential?
As AI agents become embedded in high-impact enterprise workflows—such as financial operations, customer support, and regulated environments—the cost of failure extends beyond technical errors to business outcomes, user trust, and compliance. Monitoring provides the visibility needed to assess agent performance across tasks, identify workflow breakdowns, and maintain consistency across operations.
By analyzing task execution, session-level activity, and performance trends, organizations can move beyond relying solely on final outputs and gain a clearer, more actionable view of system behavior.
The following comparison illustrates how monitoring directly impacts operational visibility and reliability in real-world scenarios:
Understanding ZBrain Builder metrics for agent monitoring
ZBrain Builder enables performance evaluation of AI agents through built-in monitoring metrics that provide visibility into utilization, efficiency and cost. These metrics help teams understand how agents perform in real-world scenarios and identify opportunities for optimization.

Summary metrics
The summary metrics display aggregated information about an agent’s activity and operational behavior. A specific time range can be selected if needed; otherwise, all entries are displayed by default.
-
Utilized time: Shows the total duration the agent has been actively processing tasks. This value represents overall usage.
-
Average session time: The average time it takes for an agent to complete a task. It helps assess typical processing duration across tasks and identify potential areas to reduce latency or improve throughput.
-
Satisfaction score: An average score reflecting the quality of the tasks performed by the agent. This score is derived from user feedback on the chat interface or dashboard.
-
Tokens used: Displays the total number of tokens consumed by the agent during all sessions. This metric provides insight into computational resource utilization and associated costs.
Session details
In addition to summary data, ZBrain Builder provides detailed records for each processing session. These logs offer task-level visibility through the following parameters:
-
Session ID: A unique identifier for each processing session.
-
Record name: The name or identifier associated with the processed task.
-
Session start date/end date: Timestamps indicating the start and end dates of the session.
-
Session time: Total duration of the session.
-
Satisfaction score: The rating or feedback score assigned to a session.
-
Tokens used: Number of tokens consumed during the session.
-
Cost: Estimated cost linked to the session’s token usage.
This information allows users to review individual sessions, compare performance across tasks and track cost or efficiency patterns at a granular level.
ZBrain Builder’s performance metrics and session-level insights provide a foundational understanding of agent efficiency and resource utilization. These insights are visualized and managed through ZBrain Builder’s performance dashboards. By reviewing this data, teams can maintain operational consistency, identify performance variations and make informed adjustments to agent configurations as needed.
The following section covers the detailed capabilities of the ZBrain Builder dashboards used for monitoring and managing AI agents.
Post-deployment monitoring and effective management of ZBrain AI agents
Once deployed, effective management and monitoring of ZBrain AI agents are essential to ensure they perform reliably, deliver consistent results and align with organizational goals. ZBrain Builder provides a unified environment for managing agents across their lifecycle – from deployment to continuous optimization – through a combination of dashboards, queues, activity logs and performance analytics.
Centralized Agent Dashboard overview
The overall Agents Dashboard serves as the central management interface, providing teams with real-time visibility into all active and draft agents. Each entry displays essential details, including the agent’s ID, name, type (Agent or Crew), accuracy, action required, number of completed tasks and the timestamp of the last execution status.

This consolidated view enables teams to quickly assess operational health, track progress and identify agents that may require attention. Key dashboard attributes include:
-
Agent ID and name: Unique identifiers and descriptive titles (e.g., Resume Screening Agent) for easier tracking.
-
Type: Indicates whether the agent is an individual agent (built with Flows) or part of a crew (built using the Crew framework).
-
Accuracy: Displays the performance accuracy of the agent, reflecting reliability.
-
Action required: Redirects to actions needed to resolve failed or incomplete tasks.
-
Tasks completed: The total number of tasks successfully executed.
-
Last task execution: Date and time when the agent last processed a task.
-
Status: Indicates whether the agent is in active or draft mode.
Monitoring task status

The dashboard provides visibility into each agent’s active and completed tasks, supporting real-time operational oversight. Color-coded indicators simplify monitoring:
-
Green dot: Indicates that the task has been completed without any issues.
-
Yellow dot: Signifies that the task is pending and awaiting processing. This may occur if there is a queue of tasks or a delay in processing.
-
Red dot: Indicates that the task has failed, signifying issues with processing, such as errors or system failures.
Monitoring task statuses in real time enables teams to identify and prioritize areas that require intervention, take corrective action promptly and maintain continuity.
Queue management

Efficient task queue management is essential to maintaining throughput and ensuring balanced agent performance. The Queue Panel enables users to filter and sort tasks by execution status, facilitating focused review and effective management. This feature streamlines the tracking of specific tasks, enabling efficient workflow management. Available filter options include:
-
Show all: Displays every task, regardless of its current state.
-
Processing: Tasks actively being executed by the agent.
-
Pending: Tasks awaiting execution, often queued for processing.
-
Completed: Tasks that have been successfully finalized.
-
Failed: Tasks that encountered errors or interruptions.
Applying these filters enables teams to track task progression, identify performance bottlenecks and manage document pipelines efficiently.
Performance tracking and operational visibility
To evaluate agent performance in production, the Performance Dashboard presents key metrics – including Utilized Time, Average Session Time, Satisfaction Score, Tokens Used and Cost. These indicators help teams assess operational efficiency, monitor resource usage and maintain a balance between performance and expenditure.
Session-level insights
For deeper visibility, the ZBrain Builder Dashboard provides session-level records within the Performance section. Each record details an individual task, allowing granular analysis of how the agent executed a process.

Each session record captures essential execution details, including session ID, record name, start and end date, session time, status, tokens used and cost. These fields provide a complete snapshot of individual task executions, helping teams trace performance, measure efficiency and correlate resource usage with outcomes.
Together, these insights enable teams to review processing outcomes, compare performance across sessions and identify trends that inform ongoing optimization.
Token usage and cost tracking in agent activity
ZBrain Builder also provides precise tracking of token usage and cost at the model level through the Agent Activity view. This feature delivers transparency into resource consumption for each executed model step, supporting detailed cost analysis and optimization.

Within the Agent Activity panel, selecting a specific model step displays corresponding metrics in the Step Overview section, including:
-
Tokens used: The number of tokens processed during the model’s execution.
-
Cost ($): The associated expense for that specific model invocation.
This fine-grained tracking supports informed cost management, effective budget control and data-driven optimization of resource allocation.
ZBrain Builder’s post-deployment monitoring and management capabilities provide a comprehensive view of agent performance and queue activity, enabling teams to maintain operational efficiency. By combining centralized dashboards, performance metrics, detailed session logs and transparent queue management, organizations can maintain reliable AI operations, monitor costs and continually improve performance. This structured, data-driven visibility ensures that ZBrain agents remain consistent, efficient and aligned with evolving operational and business objectives.
Inspecting agent crews and assessing performance
ZBrain Builder’s Agent Crew feature enables multi-agent orchestration, where a supervisor agent coordinates multiple sub-agents to execute complex workflows. This hierarchical setup enables enterprises to break down large tasks into specialized roles, ensuring structured automation, clear task ownership and consistent outcomes.
Crew activity: Tracing agent collaboration
The Crew Activity panel provides a chronological record of all agent actions within a crew, capturing both reasoning and execution flow. Each activity log outlines how agents think, plan and act in real time – including internal reasoning text and any tools or APIs invoked during execution. This traceability helps teams understand how tasks progress within a crew, validate logic flow and debug execution paths when needed.
This feature allows teams to review the crew’s decision-making process step by step, verify task handoffs and ensure actions align with defined logic and workflow objectives.

Performance Dashboard for agent crews
The Crew Performance Dashboard provides a snapshot of key operational indicators such as Utilized Time, Average Session Time, Satisfaction Score, Tokens Used and Cost – similar to the agent’s Performance Dashboard discussed earlier.
These insights help assess collective efficiency, resource utilization and performance consistency across the crew, offering a unified view of how multiple agents work together toward shared objectives.
Introducing ZBrain Monitor module for comprehensive oversight
After exploring the ZBrain agents’ Performance Dashboard and its high-level metrics, let’s move to an even more powerful capability: the ZBrain Builder’s Monitor module. While the dashboard summarizes overall health and usage-specific details, the ZBrain Monitor module lets you define granular evaluation criteria for every session, input and output. The next section explains how to configure and use the ZBrain Builder’s Monitor module to achieve precision-level monitoring and control.
The ZBrain Monitor module delivers end-to-end visibility and control of all AI agents by automating both evaluation and performance tracking. With real-time monitoring, the ZBrain Monitor module ensures response quality, proactively detects emerging issues and maintains optimal operational performance across every deployed solution.
It operates by capturing inputs and outputs from your applications, continuously evaluating responses against user-defined metrics at scheduled intervals. This automated process delivers real-time insights – including success and failure rates. All results are presented through an intuitive interface, enabling rapid identification and resolution of issues and ensuring consistent, high-quality AI interactions.
Key capabilities of ZBrain Monitor module:
-
Automated evaluation: Flexible use of LLM-based, non-LLM-based, performance metrics and LLM-as-a-judge metrics for effective, scenario-specific monitoring.
-
Performance tracking: Identify success/failure trends in agent performance through visual logs and comprehensive reports.
-
Query-level monitoring: Configure granular evaluations at the query level within each session, enabling precise oversight of agent behaviors.
-
Agent and app support: ZBrain Monitor module supports oversight of both AI apps and AI agents, providing end-to-end visibility across enterprise AI operations. However, this article focuses exclusively on AI agent monitoring.
-
Input flexibility: Evaluate responses for a variety of supported file types.
-
Notification alerts: Enable real-time notifications for event status updates when an event succeeds or fails.
With these capabilities, ZBrain Builder’s Monitor module enables teams to achieve continuous, automated, and actionable oversight of AI agents, driving higher reliability, faster issue resolution, and sustained performance improvements at scale.
Exploring ZBrain Monitor Interface: Core modules
As AI agents become integral to enterprise automation, maintaining their accuracy, reliability and responsiveness is essential. ZBrain Builder’s Monitor module provides structured observability for deployed agents, enabling teams to evaluate outputs, detect deviations and maintain quality standards through automated, metric-driven monitoring. The Monitor module within ZBrain Builder provides a unified workspace to define, track and analyze the performance of AI agents in production.
The module enables real-time oversight, continuously assessing agent performance against defined metrics and alerting teams to anomalies or failures. This ensures proactive intervention, sustained reliability and consistent, high-quality AI performance.
The ZBrain Monitor interface is organized into four primary sections accessible from the left navigation panel:

-
Events: View and manage all configured monitoring events in a centralized list.
-
Monitor logs: Review detailed execution outcomes and the evaluation metrics applied, visualized with color-coded status indicators for quick insight.
-
Event settings: Access monitored inputs and outputs, and manage evaluation metrics, thresholds, frequency and notifications to define tailored and effective monitoring strategies.
-
User management: Control access through role-based permissions, ensuring secure, accountable monitoring operations.
ZBrain Builder’s Monitor module automates agent oversight, transforming continuous evaluations into real-time operational insights that enable teams to maintain stability, detect deviations early and optimize performance.
Events: Centralized monitoring visibility

The Events view, located under the Monitor tab, serves as the central hub for all configured and planned monitoring events. Each row represents a distinct evaluation instance, displaying key operational details such as:
-
Agent name and type: Identifies which agent (e.g., Summarizer Agent) is being evaluated.
-
Input and output: Summarizes the data being monitored and generated outputs.
-
Run frequency: Defines how often the agent’s performance is monitored (e.g., hourly, daily).
-
Last run and status: Displays the latest monitoring timestamp and outcome (e.g., success, failed).
This consolidated view provides visibility into all monitors – whether active or pending setup – helping teams oversee agent status and identify those that need configuration or further review.
Event settings: Defining how agents are evaluated
The Event Settings module allows teams to configure how each AI agent is evaluated during monitoring.

Key configuration components include:
-
Monitored input and output: Specifies which specific input or agent-generated output is subject to evaluation.
-
Frequency of evaluation: Defines how often performance checks are executed – hourly, daily, weekly, etc.
-
Evaluation metrics: ZBrain Builder supports a comprehensive set of metrics. Multiple metrics can be combined using AND/OR logic, and thresholds can be set to determine pass or fail outcomes. This flexibility ensures monitoring conditions reflect real business needs, whether accuracy, relevance or performance speed is the priority.
Choose from a wide range of predefined metrics tailored to agent performance:
| Scenario | With Monitoring | Without Monitoring |
|---|---|---|
| Incorrect or suboptimal output | Session records and performance metrics help identify patterns and diagnose issues. | Only final output is visible, making it difficult to determine the cause. |
| Workflow inefficiencies | Session-level insights help identify delays, failed tasks, and bottlenecks by analyzing session duration, task status, and processing time across tasks. | Inefficiencies remain hidden, impacting performance and cost. |
| Task failures | Status tracking (completed, pending, failed) enables quick identification and resolution. | Failures may go unnoticed or require manual investigation. |
| Cost overruns | Token usage and session-level cost tracking enable optimization. | Resource usage is difficult to track and control. |
| Compliance and audit requirements | Session-level records and activity logs provide traceability and support audit requirements. | Limited visibility into system behavior and execution outcomes. |
AI agents require continuous monitoring to ensure reliability, transparency and sustained performance across evolving business contexts. By tracking the right metrics, organizations can proactively optimize agent behavior and drive measurable value.
Potential challenges and blind spots in AI agent monitoring
AI agent monitoring is inherently more complex than traditional system monitoring due to the dynamic, non-deterministic, and multi-step nature of these systems. Unlike conventional applications, agent failures are often subtle, distributed across workflows, and difficult to diagnose, requiring more adaptive and structured evaluation approaches.
Data and context variability: AI agents encounter diverse and unpredictable inputs across tasks and sessions. Variations in user queries, data sources, and workflows can lead to inconsistent outcomes, making it difficult to establish reliable performance benchmarks without contextual awareness.
Maintaining consistent performance: Ensuring consistent performance across sessions is challenging as agents operate in evolving environments. Changes in inputs, workflows, or external dependencies can introduce variability, requiring continuous monitoring to maintain reliability.
Defining meaningful and consistent evaluation metrics: There is no standardized framework for evaluating AI agent performance. Organizations must balance quantitative metrics (e.g., latency, tokens used) with qualitative signals (e.g., relevance, satisfaction), while ensuring consistency across use cases and teams.
Evaluation subjectivity: Assessing AI outputs often involves subjective criteria such as relevance, clarity, or usefulness. Ensuring consistent evaluation—whether through user feedback or structured scoring—requires well-defined criteria and continuous calibration.
Scale, speed, and cost trade-offs: AI agents can process large volumes of tasks rapidly, making comprehensive monitoring computationally intensive. Organizations must balance the depth and frequency of monitoring with cost and performance considerations.
Challenges in identifying root causes of failures: When an agent produces incorrect or suboptimal outputs, identifying the root cause is not straightforward. Issues may stem from input quality, workflow configuration, or execution patterns, complicating debugging and optimization.
Limited visibility into decision logic and execution: AI agents generate outputs through multi-step processes that are not always fully transparent. This limits visibility into how decisions are made, making it harder to validate behavior, build trust, and diagnose inconsistencies.
Managing tool and integration complexity: As agents interact with multiple external systems, APIs, and data sources, tracking dependencies and identifying issues across integrations becomes increasingly complex without centralized monitoring.
Balancing autonomy with control: AI agents require a degree of autonomy to function effectively, but insufficient oversight introduces risks, while excessive constraints can limit adaptability. Achieving the right balance remains a key challenge.
Managing alert noise and false positives: Monitoring systems may generate excessive alerts due to normal variations in agent behavior. Filtering meaningful signals from noise is critical to avoid alert fatigue and maintain operational efficiency.
A critical part of the agent monitoring setup in Event Settings is threshold configuration. Thresholds act as cutoff values for evaluation metrics, determining whether an agent’s response meets or falls below expected performance standards. By defining these limits, teams can translate qualitative evaluation criteria – such as accuracy or clarity – into measurable, repeatable benchmarks for success.
Within Event Settings, teams can use the Test Evaluation Settings panel to validate monitoring configurations before deploying them in production. In addition to relying on system-generated outputs, evaluators can provide custom test inputs to simulate realistic or edge-case scenarios.
This flexibility allows the ZBrain Monitor module to evaluate AI agents against the criteria that matter most to each organization. Instead of relying on static or generic checks, teams can tailor monitoring to capture real-world agent behavior, compliance-specific validations or high-impact failure scenarios. It helps teams fine-tune thresholds, reduce false positives and confirm metric accuracy under controlled conditions – strengthening quality assurance before production rollout.
Streamline your operational workflows with ZBrain AI agents designed to address enterprise challenges.
Best practices for monitoring AI agents
Monitoring AI agents is not just a technical necessity – it’s a strategic imperative. From ensuring real-time reliability to long-term cost efficiency, effective monitoring helps teams identify issues early, validate agent behavior and continuously refine performance. The following best practices provide a strong foundation for scalable, secure and intelligent agent oversight.
1. Establish real-time monitoring from day one
Set up observability and monitoring tools early in the agent development lifecycle. Logging and tracing should be embedded into workflows before agents move to production.
Key practices:
-
Capture detailed logs of each execution step, including function or tool calls, context usage and response latency.
-
Monitor system health in real time – track CPU, memory and token consumption to detect overloads or failure patterns.
-
Configure automated alerts for high-latency sessions, failed tasks or unusual cost spikes.
This proactive approach prevents blind spots and enables teams to resolve performance issues before they impact end users.
2. Use dashboards as a central monitoring hub
Custom dashboards are essential for visualizing and responding to live performance signals. They centralize critical metrics and provide clarity for both technical and business stakeholders.
Dashboard best practices:
-
Highlight key indicators such as response time, success rate, token usage and satisfaction score.
-
Set custom alerts for deviation thresholds – such as drops in task success or spikes in token consumption.
-
Visualize historical performance to spot trends, regressions or emerging patterns over time.
An effective dashboard transforms data into decisions – supporting daily operational control and long-term agent optimization.
3. Conduct regular data reviews with human oversight
Automated monitoring is powerful, but human judgment adds essential context – especially in cases of ambiguous agent behavior.
Recommended practices:
-
Review task sessions weekly or monthly to audit failure reasons and behavioral edge cases.
-
Use diagnostic tools (e.g., confusion matrices or input-output analysis) to evaluate accuracy trends.
-
Pair these reviews with scheduled security checks, including access controls and data protection audits.
A structured review cadence ensures the agent remains aligned with evolving user expectations and compliance requirements.
4. Leverage advanced monitoring techniques
Move beyond static thresholds with adaptive, intelligent monitoring. These methods allow teams to anticipate problems rather than react to them.
Advanced methods include:
-
Implementing evaluation frameworks that assess routing logic, tool usage and iteration loops.
-
Using A/B testing and controlled experiments to compare prompt variants, workflows or response strategies.
-
Tracking agent “execution paths” to identify unnecessary loops, repeated steps or failed tool sequences.
These techniques help refine both agent architecture and user outcomes – based on real behavioral data, not guesswork.
5. Adopt a proactive, iterative monitoring culture
Monitoring is not a one-time setup – it’s an ongoing process. Treat it as a strategic function that evolves with your AI agents.
Operational tips:
-
Audit your monitoring setup quarterly to identify process gaps, inefficiencies or technical bottlenecks.
-
Use feedback loops (via agent rating systems or session scoring) to drive iterative improvements.
-
Stay aligned with emerging observability standards to future-proof your setup as the ecosystem matures.
When monitoring is built into the core of your agent orchestration framework, you ensure every deployment is measurable, improvable and resilient.
6. Define clear success criteria and thresholds
Effective monitoring requires clearly defined benchmarks for success. Without thresholds, metrics lack actionable meaning.
Key practices:
-
Define acceptable ranges for key metrics such as session time, cost, and satisfaction score
-
Set thresholds for task success and failure rates
-
Use these benchmarks to trigger alerts or corrective actions
This ensures monitoring systems can distinguish between normal variations and actual performance issues.
Exploring ZBrain Builder metrics for agent monitoring
ZBrain Builder enables performance evaluation of AI agents through built-in monitoring metrics that provide visibility into utilization, efficiency and cost. These metrics help teams understand how agents perform in real-world scenarios and identify opportunities for optimization.
Summary metrics
The summary metrics display aggregated information about an agent’s activity and operational behavior. A specific time range can be selected if needed; otherwise, all entries are displayed by default.
-
Utilized time: Shows the total duration the agent has been actively processing tasks. This value represents overall usage.
-
Average session time: The average time it takes for an agent to complete a task. It helps assess typical processing duration across tasks and identify potential areas to reduce latency or improve throughput.
-
Satisfaction score: An average score reflecting the quality of the tasks performed by the agent. This score is derived from user feedback on the chat interface or dashboard.
-
Tokens used: Displays the total number of tokens consumed by the agent during all sessions. This metric provides insight into computational resource utilization and associated costs.
Session details
In addition to summary data, ZBrain Builder provides detailed records for each processing session. These logs offer task-level visibility through the following parameters:
-
Session ID: A unique identifier for each processing session.
-
Record name: The name or identifier associated with the processed task.
-
Session start date/end date: Timestamps indicating the start and end dates of the session.
-
Session time: Total duration of the session.
-
Satisfaction score: The rating or feedback score assigned to a session.
-
Tokens used: Number of tokens consumed during the session.
-
Cost: Estimated cost linked to the session’s token usage.
This information allows users to review individual sessions, compare performance across tasks and track cost or efficiency patterns at a granular level.
ZBrain Builder’s performance metrics and session-level insights provide a foundational understanding of agent efficiency and resource utilization. These insights are visualized and managed through ZBrain Builder’s performance dashboards. By reviewing this data, teams can maintain operational consistency, identify performance variations and make informed adjustments to agent configurations as needed.
The following section covers the detailed capabilities of the ZBrain Builder dashboards used for monitoring and managing AI agents.
Post-deployment monitoring and effective management of ZBrain AI agents
Once deployed, effective management and monitoring of ZBrain AI agents are essential to ensure they perform reliably, deliver consistent results and align with organizational goals. ZBrain Builder provides a unified environment for managing agents across their lifecycle – from deployment to continuous optimization – through a combination of dashboards, queues, activity logs and performance analytics.
Centralized Agent Dashboard overview
The overall Agents Dashboard serves as the central management interface, providing teams with real-time visibility into all active and draft agents. Each entry displays essential details, including the agent’s ID, name, type (Agent or Crew), accuracy, action required, number of completed tasks and the timestamp of the last execution status.
This consolidated view enables teams to quickly assess operational health, track progress and identify agents that may require attention. Key dashboard attributes include:
-
Agent ID and name: Unique identifiers and descriptive titles (e.g., Resume Screening Agent) for easier tracking.
-
Type: Indicates whether the agent is an individual agent (built with Flows) or part of a crew (built using the Crew framework).
-
Accuracy: Displays the performance accuracy of the agent, reflecting reliability.
-
Action required: Redirects to actions needed to resolve failed or incomplete tasks.
-
Tasks completed: The total number of tasks successfully executed.
-
Last task execution: Date and time when the agent last processed a task.
-
Status: Indicates whether the agent is in active or draft mode.
Monitoring task status
The dashboard provides visibility into each agent’s active and completed tasks, supporting real-time operational oversight. Color-coded indicators simplify monitoring:
-
Green dot: Indicates that the task has been completed without any issues.
-
Yellow dot: Signifies that the task is pending and awaiting processing. This may occur if there is a queue of tasks or a delay in processing.
-
Red dot: Indicates that the task has failed, signifying issues with processing, such as errors or system failures.
Monitoring task statuses in real time enables teams to identify and prioritize areas that require intervention, take corrective action promptly and maintain continuity.
Queue management
Efficient task queue management is essential to maintaining throughput and ensuring balanced agent performance. The Queue Panel enables users to filter and sort tasks by execution status, facilitating focused review and effective management. This feature streamlines the tracking of specific tasks, enabling efficient workflow management. Available filter options include:
-
Show all: Displays every task, regardless of its current state.
-
Processing: Tasks actively being executed by the agent.
-
Pending: Tasks awaiting execution, often queued for processing.
-
Completed: Tasks that have been successfully finalized.
-
Failed: Tasks that encountered errors or interruptions.
Applying these filters enables teams to track task progression, identify performance bottlenecks and manage document pipelines efficiently.
Performance tracking and operational visibility
To evaluate agent performance in production, the Performance Dashboard presents key metrics – including Utilized Time, Average Session Time, Satisfaction Score, Tokens Used and Cost. These indicators help teams assess operational efficiency, monitor resource usage and maintain a balance between performance and expenditure.
Session-level insights
For deeper visibility, the ZBrain Builder Dashboard provides session-level records within the Performance section. Each record details an individual task, allowing granular analysis of how the agent executed a process.
Each session record captures essential execution details, including session ID, record name, start and end date, session time, status, tokens used and cost. These fields provide a complete snapshot of individual task executions, helping teams trace performance, measure efficiency and correlate resource usage with outcomes.
Together, these insights enable teams to review processing outcomes, compare performance across sessions and identify trends that inform ongoing optimization.
Token usage and cost tracking in agent activity
ZBrain Builder also provides precise tracking of token usage and cost at the model level through the Agent Activity view. This feature delivers transparency into resource consumption for each executed model step, supporting detailed cost analysis and optimization.
Within the Agent Activity panel, selecting a specific model step displays corresponding metrics in the Step Overview section, including:
-
Tokens used: The number of tokens processed during the model’s execution.
-
Cost ($): The associated expense for that specific model invocation.
This fine-grained tracking supports informed cost management, effective budget control and data-driven optimization of resource allocation.
ZBrain Builder’s post-deployment monitoring and management capabilities provide a comprehensive view of agent performance and queue activity, enabling teams to maintain operational efficiency. By combining centralized dashboards, performance metrics, detailed session logs and transparent queue management, organizations can maintain reliable AI operations, monitor costs and continually improve performance. This structured, data-driven visibility ensures that ZBrain agents remain consistent, efficient and aligned with evolving operational and business objectives.
Inspecting agent crews and assessing performance
ZBrain Builder’s Agent Crew feature enables multi-agent orchestration, where a supervisor agent coordinates multiple sub-agents to execute complex workflows. This hierarchical setup enables enterprises to break down large tasks into specialized roles, ensuring structured automation, clear task ownership and consistent outcomes.
Crew activity: Tracing agent collaboration
The Crew Activity panel provides a chronological record of all agent actions within a crew, capturing both reasoning and execution flow. Each activity log outlines how agents think, plan and act in real time – including internal reasoning text and any tools or APIs invoked during execution. This traceability helps teams understand how tasks progress within a crew, validate logic flow and debug execution paths when needed.
This feature allows teams to review the crew’s decision-making process step by step, verify task handoffs and ensure actions align with defined logic and workflow objectives.
Performance Dashboard for agent crews
The Crew Performance Dashboard provides a snapshot of key operational indicators such as Utilized Time, Average Session Time, Satisfaction Score, Tokens Used and Cost – similar to the agent’s Performance Dashboard discussed earlier.
These insights help assess collective efficiency, resource utilization and performance consistency across the crew, offering a unified view of how multiple agents work together toward shared objectives.
Introducing ZBrain Monitor module for comprehensive oversight
After exploring the ZBrain agents’ Performance Dashboard and its high-level metrics, let’s move to an even more powerful capability: the ZBrain Builder’s Monitor module. While the dashboard summarizes overall health and usage-specific details, the ZBrain Monitor module lets you define granular evaluation criteria for every session, input and output. The next section explains how to configure and use the ZBrain Builder’s Monitor module to achieve precision-level monitoring and control.
The ZBrain Monitor module delivers end-to-end visibility and control of all AI agents by automating both evaluation and performance tracking. With real-time monitoring, the ZBrain Monitor module ensures response quality, proactively detects emerging issues and maintains optimal operational performance across every deployed solution.
It operates by capturing inputs and outputs from your applications, continuously evaluating responses against user-defined metrics at scheduled intervals. This automated process delivers real-time insights – including success and failure rates. All results are presented through an intuitive interface, enabling rapid identification and resolution of issues and ensuring consistent, high-quality AI interactions.
Key capabilities of ZBrain Monitor module:
-
Automated evaluation: Flexible use of LLM-based, non-LLM-based, performance metrics and LLM-as-a-judge metrics for effective, scenario-specific monitoring.
-
Performance tracking: Identify success/failure trends in agent performance through visual logs and comprehensive reports.
-
Query-level monitoring: Configure granular evaluations at the query level within each session, enabling precise oversight of agent behaviors.
-
Agent and app support: ZBrain Monitor module supports oversight of both AI apps and AI agents, providing end-to-end visibility across enterprise AI operations. However, this article focuses exclusively on AI agent monitoring.
-
Input flexibility: Evaluate responses for a variety of supported file types.
-
Notification alerts: Enable real-time notifications for event status updates when an event succeeds or fails.
With these capabilities, ZBrain Builder’s Monitor module enables teams to achieve continuous, automated, and actionable oversight of AI agents, driving higher reliability, faster issue resolution, and sustained performance improvements at scale.
Exploring ZBrain Monitor Interface: Core modules
As AI agents become integral to enterprise automation, maintaining their accuracy, reliability and responsiveness is essential. ZBrain Builder’s Monitor module provides structured observability for deployed agents, enabling teams to evaluate outputs, detect deviations and maintain quality standards through automated, metric-driven monitoring. The Monitor module within ZBrain Builder provides a unified workspace to define, track and analyze the performance of AI agents in production.
The module enables real-time oversight, continuously assessing agent performance against defined metrics and alerting teams to anomalies or failures. This ensures proactive intervention, sustained reliability and consistent, high-quality AI performance.
The ZBrain Monitor interface is organized into four primary sections accessible from the left navigation panel:
-
Events: View and manage all configured monitoring events in a centralized list.
-
Monitor logs: Review detailed execution outcomes and the evaluation metrics applied, visualized with color-coded status indicators for quick insight.
-
Event settings: Access monitored inputs and outputs, and manage evaluation metrics, thresholds, frequency and notifications to define tailored and effective monitoring strategies.
-
User management: Control access through role-based permissions, ensuring secure, accountable monitoring operations.
ZBrain Builder’s Monitor module automates agent oversight, transforming continuous evaluations into real-time operational insights that enable teams to maintain stability, detect deviations early and optimize performance.
Events: Centralized monitoring visibility
The Events view, located under the Monitor tab, serves as the central hub for all configured and planned monitoring events. Each row represents a distinct evaluation instance, displaying key operational details such as:
-
Agent name and type: Identifies which agent (e.g., Summarizer Agent) is being evaluated.
-
Input and output: Summarizes the data being monitored and generated outputs.
-
Run frequency: Defines how often the agent’s performance is monitored (e.g., hourly, daily).
-
Last run and status: Displays the latest monitoring timestamp and outcome (e.g., success, failed).
This consolidated view provides visibility into all monitors – whether active or pending setup – helping teams oversee agent status and identify those that need configuration or further review.
Event settings: Defining how agents are evaluated
The Event Settings module allows teams to configure how each AI agent is evaluated during monitoring.
Key configuration components include:
-
Monitored input and output: Specifies which specific input or agent-generated output is subject to evaluation.
-
Frequency of evaluation: Defines how often performance checks are executed – hourly, daily, weekly, etc.
-
Evaluation metrics: ZBrain Builder supports a comprehensive set of metrics. Multiple metrics can be combined using AND/OR logic, and thresholds can be set to determine pass or fail outcomes. This flexibility ensures monitoring conditions reflect real business needs, whether accuracy, relevance or performance speed is the priority.
Choose from a wide range of predefined metrics tailored to agent performance:
| Metric category | Metric name | Purpose | Example use case |
|---|---|---|---|
| LLM-based metrics | Response relevancy | Evaluates how well the agent’s generated output aligns with the user’s input or task intent. Higher scores indicate better contextual alignment. | Used for conversational or support agents to ensure responses directly address user queries. |
| Faithfulness | Measures whether the agent’s response accurately reflects the provided context, minimizing factual or logical inconsistencies. | Essential for context-driven agents to validate that generated content is grounded in source data. | |
| Non-LLM metrics | Health check | Verifies that the agent is operational and capable of generating valid responses. Monitoring halts further checks on failure. | Run at the start of every execution for operational monitoring. |
| Exact match | Compares the agent’s response against the expected output for identical or deterministic answers. | Useful for structured data extraction agents where precision is critical. | |
| F1 score | Balances precision and recall to assess how effectively the agent’s output matches expected results. | Applied to classification or QA-based agents evaluating answer accuracy. | |
| Levenshtein similarity | Calculates how closely two text strings match by counting the minimal edits needed to convert one into the other. | Detects near-match variations in generated text for validation agents. | |
| ROUGE-L score | Evaluates similarity by identifying the longest common sequence of words between the generated and reference text. | Suitable for summarization or paraphrasing agents to ensure content completeness. | |
| Performance metrics | Response latency | Tracks how quickly the agent produces an output after receiving a query. | Monitors latency for production-grade or real-time interaction agents. |
| LLM-as-a-Judge metrics | Creativity | Rates how original or adaptive the agent’s responses are in addressing a given task. | Applied to ideation or content-generation agents where variation and novelty are desirable. |
| Helpfulness | Evaluates how effectively the agent’s response aids users in resolving their query or completing a task. | Relevant for advisory or customer support agents. | |
| Clarity | Measures how easy the agent’s response is to understand and how clearly it communicates information. | Ensures task execution agents produce concise and readable outputs. |
A critical part of the agent monitoring setup in Event Settings is threshold configuration. Thresholds act as cutoff values for evaluation metrics, determining whether an agent’s response meets or falls below expected performance standards. By defining these limits, teams can translate qualitative evaluation criteria – such as accuracy or clarity – into measurable, repeatable benchmarks for success.
Within Event Settings, teams can use the Test Evaluation Settings panel to validate monitoring configurations before deploying them in production. In addition to relying on system-generated outputs, evaluators can provide custom test inputs to simulate realistic or edge-case scenarios.
This flexibility allows the ZBrain Monitor module to evaluate AI agents against the criteria that matter most to each organization. Instead of relying on static or generic checks, teams can tailor monitoring to capture real-world agent behavior, compliance-specific validations or high-impact failure scenarios. It helps teams fine-tune thresholds, reduce false positives and confirm metric accuracy under controlled conditions – strengthening quality assurance before production rollout.
Monitor Logs: Turning agent evaluations into insight
Once monitoring is active, Monitor Logs automatically capture detailed evaluation records for every monitored event. These logs provide teams with an intuitive, structured view of system performance over time.
Each log captures detailed evaluation results, applied metrics and execution frequency. Results are visualized through color-coded indicators, making performance patterns and anomalies immediately visible.
Each log entry includes:
-
Event ID, log ID, entity details, event frequency, metrics used and log status
-
Execution details, such as token usage and credits consumed
-
Generated LLM responses
-
Color-coded bars to visualize success (green) or failure (red) over time
Detailed Monitor Logs helps with:
-
Instant visibility: Color-coded indicators provide a quick visual snapshot of evaluation results, enabling teams to recognize anomalies or deviations at a glance.
-
Performance trends: Aggregated evaluation records reveal recurring issues or improvements, allowing teams to track long-term performance behavior.
-
Targeted analysis: Flexible filters by evaluation status or time make it easy to focus on the most relevant monitoring runs without sifting through unnecessary detail.
-
Diagnostic context: Each log consolidates what was evaluated, how the agent performed against metrics and the outcome, accelerating the path from detection to root-cause analysis.
-
Accountability and auditability: Monitor Logs create a transparent performance trail essential for compliance checks, stakeholder reporting and continuous optimization.
By transforming raw monitoring data into structured insights, the ZBrain Monitor module enables organizations to identify performance drifts early, validate agent reliability and maintain operational transparency across production environments.
User management: Governance and secure collaboration for agent monitoring
The User Management module provides governance and access control specifically for agent monitoring activities. Administrators can determine who can view, configure or manage monitoring events through two modes:
-
Custom access: Specific builders or users are invited to manage the event. A builder is a user who can add, update or operate ZBrain knowledge bases, apps, flows and agents. This option ensures monitoring for critical agents or apps stays restricted to designated owners.
-
Everyone access: The event is visible and manageable by everyone in the organization, enabling open collaboration on shared monitoring initiatives.
By tailoring access, organizations enhance governance, security and accountability in monitoring setup.
-
Strengthen governance: Restrict configuration rights for sensitive monitoring rules and thresholds to authorized builders responsible for specific agents.
-
Enable accountability: Track who manages each monitoring event, ensuring clear ownership and auditability across teams.
-
Balance control and collaboration: Apply strict ownership for compliance-critical agents while enabling open collaboration where flexibility is acceptable.
This role-based access model keeps agent monitoring secure, auditable and collaborative, ensuring that oversight remains applied at the right operational level.
By leveraging the ZBrain Builder Monitor module, enterprises ensure their AI agents consistently meet defined standards for accuracy, reliability and performance, thereby reinforcing trust in automated decision-making systems.
Driving reliability through continuous agent monitoring
The ZBrain Builder Monitor module elevates post-deployment AI agent oversight into a continuous, intelligence-driven process. By integrating automated evaluations and customizable metrics, it ensures agents consistently perform within defined quality and performance thresholds.
For organizations scaling intelligent automation, the ZBrain Builder’s Monitor capability delivers the assurance needed to maintain trustworthy, high-performing AI agents across dynamic production environments.
Key benefits of monitoring AI agents
Let’s explore the key benefits of monitoring AI agents in this section:
Performance insights: Monitoring provides crucial data on AI agent performance, including accuracy, response times and satisfaction score. For instance, ZBrain’s Utilized Time metric reveals how long agents take to complete tasks, helping teams identify and fix performance bottlenecks.
Efficiency optimization: By identifying resource usage patterns, monitoring helps optimize the cost-effectiveness and scalability of operations. ZBrain’s Tokens Used metric measures how efficiently the agent uses computational resources, enabling precise cost control.
Reliability tracking: Consistent performance is essential for the dependability of AI agents. ZBrain’s Satisfaction Score and Accuracy metrics provide insight into the stability and quality of agent outcomes over time.
Faster issue detection and resolution: Continuous monitoring enables teams to quickly identify failures, inefficiencies, or anomalies in agent behavior. Early detection reduces the time required to diagnose and resolve issues, minimizing operational disruption.
User experience enhancement: Monitoring also evaluates user satisfaction and usability to enhance interaction quality and engagement.
Continuous improvement: Effective monitoring supports ongoing training and adaptation, ensuring AI agents remain efficient in dynamic environments.
Traceability and compliance assurance: ZBrain’s monitoring capabilities establish a verifiable audit trail of agent activity, capturing session-level records, evaluation metrics and execution outcomes. This traceability enables compliance reviews, governance reporting and accountability across AI workflows – ensuring agents operate transparently and in accordance with enterprise and regulatory standards.
Cost-effectiveness and accuracy trade-off management: AI agent monitoring helps manage the balance between achieving high accuracy and controlling operational costs. Real-time monitoring of model usage and costs supports strategic decisions on resource allocation and operational budgeting, ensuring agents deliver desired performance efficiently.
Enhanced debugging and error resolution: Monitoring intermediate steps in AI agent processes is essential for debugging complex tasks where early inaccuracies can lead to systemwide failures. The ability to continually test agents against known edge cases – and integrate new ones found in production – improves robustness and reliability.
Improved user interaction insights: Analyzing how users interact with AI agents provides critical insights that refine and tailor AI applications to meet user needs more effectively. Capturing user feedback provides a measure of quality over time and across different versions. Additionally, monitoring cost metrics enables precise optimizations that enhance both user experience and operational efficiency.
The future of AI agent monitoring: Key trends and enhancements
The field of AI agent monitoring is rapidly evolving, driven by the increasing sophistication of agents and their deeper integration into critical business processes. As organizations move beyond initial implementations, monitoring strategies must mature to ensure sustained performance, reliability and value alignment. Based on current trajectories and identified needs, several key future trends and enhancements are emerging.
-
Business-aligned metrics: AI agent monitoring metrics must directly align with business objectives rather than technical performance alone, ensuring AI agents deliver meaningful organizational value. As the AI landscape evolves, there is an increased focus on developing metrics that assess ethical considerations, transparency and fairness. These metrics ensure AI systems operate responsibly and do not perpetuate biases, aligning AI operations with emerging ethical standards and regulatory requirements. Clear outcome targets also drive better optimization decisions, shifting focus from process efficiency to result quality.
-
Workforce transformation: Human teams must evolve alongside AI technology, developing specialized skills in monitoring, evaluating and optimizing AI performance.
-
Sophisticated outcome evaluation with human-in-the-loop: Evaluating whether an agent’s output aligns with desired goals or complex requirements often involves subjective judgment that automation alone cannot capture. While automated evaluation metrics will improve, complex or nuanced tasks will necessitate robust human feedback mechanisms integrated directly into monitoring workflows. Expect tools that streamline the capture, aggregation and analysis of human evaluations – such as expert reviews and user feedback – to continuously refine agent performance and retrain models based on qualitative assessments, moving beyond simple pass-fail metrics.
-
Unified monitoring dashboards: Future iterations will likely centralize all monitoring capabilities in comprehensive dashboards accessible to all stakeholders, eliminating the need to engage specialists for monitoring insights.
-
Monitoring multi-agent workflows: As organizations adopt multi-agent systems, monitoring must extend beyond individual agents to track how tasks flow across multiple agents. This includes understanding task handoffs, execution outcomes, and performance across coordinated workflows. As multi-agent architectures grow, ensuring visibility across these interactions will become increasingly important for maintaining reliability and performance.
-
Enhanced explainability and interpretability: Knowing that an agent failed is insufficient; understanding why is critical, especially as agent workflows become more complex. Monitoring platforms will incorporate advanced explainability features, visualizing the agent’s decision-making process, tracing data flow through intricate workflows and pinpointing the exact source of errors or unexpected behavior. Explainability and interpretability in AI metrics are becoming essential as organizations strive to enhance trust and oversight. Implementing metrics that measure AI transparency helps ensure systems are understandable and accountable – a critical requirement as AI decision-making becomes more integrated into business operations.
-
AI FinOps and cost-to-value optimization: Organizations are increasingly focusing on the unit economics of AI agents—measuring cost relative to the value delivered. Monitoring is shifting from tracking total token usage to understanding cost per task or workflow. This enables teams to identify inefficient processes, optimize resource allocation, and ensure AI deployments remain economically viable at scale.
-
Integrated time-based alerting: Generative AI platforms will likely expand their capabilities to automatically flag when steps consistently exceed expected execution times, allowing for proactive workflow optimization.
-
Leveraging comprehensive monitoring solutions: Integrating advanced observability platforms with internal monitoring tools is a growing trend in AI agent management. This approach provides a comprehensive view of AI operations, combining internal performance metrics with external insights to ensure every component performs optimally – from service calls to data handling. This strategy leverages the strengths of both toolsets to enhance overall AI agent monitoring and management.
-
Standardization of AI metrics: Ongoing initiatives aim to standardize AI agent metrics, facilitating better comparison across systems and promoting best practices. Standardized metrics allow organizations to align performance expectations and benchmarks, fostering collaboration and advancing the field.
Endnote
As AI agents become central to enterprise operations, monitoring their performance is no longer a technical afterthought but a business-critical function. These agents operate in dynamic environments where their behavior can shift based on input complexity, model drift and system dependencies. Without robust monitoring, organizations risk poor outcomes, compliance issues and missed optimization opportunities.
Effective monitoring hinges on well-defined, multidimensional metrics. From token usage and latency to instruction adherence, cost efficiency and user satisfaction, these metrics form the foundation for evaluating agent efficiency, reliability and business impact. They help teams detect anomalies early, fine-tune agent behavior and continuously improve performance at scale.
ZBrain™ transforms this challenge into a streamlined, insight-driven process. It is a comprehensive platform that provides performance dashboards and key insights offering end-to-end visibility into every AI agent. By unifying technical data, user feedback and cost evaluation metrics, ZBrain™ empowers organizations to track agent activity, optimize performance and align operations with evolving business goals.
In the future of AI-driven operations, organizations that adopt structured monitoring, apply meaningful metrics and leverage platforms like ZBrain™ will be positioned to scale confidently – knowing their AI agents are functional, trustworthy, efficient and strategically valuable.
Ready to unlock the full potential of AI agents? Start building, deploying, and monitoring enterprise-grade AI agents with ZBrain. Gain real-time visibility into performance, costs, and outcomes——all within a single, unified dashboard.
Listen to the article
Author’s Bio


CEO LeewayHertz
An early adopter of emerging technologies, Akash leads innovation in AI, driving transformative solutions that enhance business operations. With his entrepreneurial spirit, technical acumen and passion for AI, Akash continues to explore new horizons, empowering businesses with solutions that enable seamless automation, intelligent decision-making, and next-generation digital experiences.
Table of content
- Understanding the difference: Monitoring, evaluation, and observability
- Why is monitoring AI agents essential?
- Potential challenges and blind spots in AI agent monitoring
- Understanding how AI agent monitoring works
- Best practices for monitoring AI agents
- Exploring ZBrain Builder metrics for agent monitoring
- Post-deployment monitoring and effective management of ZBrain AI agents
- Introducing ZBrain Monitor Module for comprehensive oversight
- Key benefits of monitoring AI agents
- The future of AI agent monitoring: Key trends and enhancements
Share Article


What is AI agent monitoring and why is it essential?
AI agent monitoring involves systematically observing and analyzing the behavior, outputs, and overall performance of AI agents to ensure they function optimally. This practice is crucial because AI agents often handle complex, variable tasks that traditional software isn’t designed for. Monitoring helps maintain reliability, ensures compliance with various standards, and optimizes operational efficiency. It also allows businesses to respond proactively to performance anomalies and security vulnerabilities, thus safeguarding both the technology and the data it processes.
How does AI agent monitoring differ from traditional software monitoring?
Unlike traditional software that performs predictable, static functions, AI agents are dynamic and can learn from new data, making their behavior less predictable. AI agent monitoring therefore goes beyond checking for system uptime or bug reports; it includes evaluating decision-making processes, adaptation to new data, and adherence to specific instructions and guidelines. Furthermore, the monitoring of AI agents often requires more granular data about decisions and actions, which necessitates the use of sophisticated analytical tools to interpret the complex data these systems generate.
What are the biggest challenges in monitoring AI agents?
Monitoring AI agents is challenging due to their non-deterministic and context-driven nature. Unlike traditional systems, AI agents can produce different outputs for similar inputs, making it difficult to define consistent benchmarks.
Additional challenges include evaluating output quality using subjective criteria, identifying root causes of failures across multi-step workflows, managing cost-performance trade-offs, and maintaining visibility across multiple tools and integrations. These complexities require structured monitoring approaches and continuous refinement.
What are the key metrics for monitoring AI agents?
Effective AI agent monitoring utilizes a range of metrics, including utilized time, average session time, satisfaction score, tokens used, and cost, along with more nuanced measures such as accuracy, response latency, and adherence to task context.
These metrics provide a multidimensional view of an agent’s performance, from technical efficiency to impact on end-users, helping organizations optimize both the agent’s functionality and its alignment with business goals. This comprehensive metric tracking is vital for ensuring that AI agents remain reliable and effective over time, adapting to new conditions and user needs without compromising their integrity or performance.
What types of issues can AI agent monitoring detect?
AI agent monitoring helps identify a range of operational and performance-related issues that may not be immediately visible in production. By analyzing session-level data, task status, and performance metrics, teams can detect anomalies early and take corrective action.
Common issues include:
-
Failed or incomplete tasks
Monitoring task status (completed, pending, failed) helps identify executions that did not finish successfully or require intervention. -
Delays and performance bottlenecks
Metrics such as session time and timestamps help detect slow task execution or processing delays that impact responsiveness. -
Inconsistent or suboptimal outputs
Variations in outputs across sessions can indicate inconsistencies in how tasks are handled, helping teams identify areas for improvement. -
Cost spikes and resource overuse
Monitoring token usage and session-level cost helps identify unusually expensive executions or inefficient resource utilization. -
Degradation in performance over time
Changes in task success rates, session duration, or satisfaction scores can indicate declining performance across sessions. -
Increased human intervention or escalations
A rise in handoffs to human users may indicate gaps in agent capability or scenarios that the agent is unable to handle effectively.
By continuously tracking these signals, organizations gain visibility into how AI agents perform in real-world conditions, enabling faster issue detection and ongoing optimization.
How does monitoring improve the management of AI agents?
Monitoring provides critical insights that can improve the accuracy and efficiency of AI agents by identifying and correcting errors, optimizing resource use, and ensuring that the agents adapt properly over time. It also helps in refining the agents based on real-world feedback, ensuring that they continue to meet organizational needs and comply with regulatory standards. By having a continuous loop of feedback and adjustment, organizations can enhance agent capabilities and ensure seamless integration into various business processes.
How does ZBrain Builder enhance the real-time monitoring of AI agents?
ZBrain’s platform provides various real-time monitoring tools specifically designed for AI agents. It also includes detailed dashboards that track key performance indicators such as response times, accuracy, and user satisfaction. These features enable users to detect performance anomalies and inefficiencies as they occur, allowing for immediate corrective actions.
What unique metrics does ZBrain Builder provide for AI agent monitoring?
ZBrain Builder offers specialized metrics tailored to the nuanced needs of AI systems. ZBrain’s Agent Performance Dashboard provides a comprehensive overview of the agent’s performance, including:
-
Utilized time: The total time the agent was active during interactions.
-
Average session time: The average time users interact with the agent per session.
-
Satisfaction score: User feedback rating the agent’s performance. This metric provides insight into the overall effectiveness of each session.
-
Tokens used: A metric for tracking the token consumption during task execution. This metric is critical for managing operational costs and understanding the resource utilization of each agent.
-
Cost: This metric indicates the total amount charged for each session based on token usage.
-
Session time: Total time spent per session. Captures the total duration of each session, offering insight into engagement length or task complexity.
-
Session start date: The date and time when the session began.
-
Session end date: The date and time when the session was concluded.
How does ZBrain Builder support the operational management of AI agents post-deployment?
ZBrain Builder simplifies the post-deployment management of AI agents through its comprehensive monitoring tools and customizable dashboards. It provides:
-
Performance Monitoring: Enables continuous tracking of key performance indicators to ensure agents operate within expected parameters.
-
Activity Logs and Reports: Offers in-depth analysis of agent operations through detailed logs and performance reports, helping identify any issues.
-
Agent Dashboard: Centralizes control and visibility, allowing users to quickly assess the health and efficiency of each agent and make adjustments as needed.
-
Feedback Mechanisms: Incorporates user feedback directly into the performance loop, enabling continuous improvement based on real-world usage and interactions.
These tools and metrics help organizations maintain high standards of performance and adapt quickly to changing operational needs, ensuring that AI agents continue to add value to business processes effectively.
What are the key benefits of monitoring AI agents?
Monitoring AI agents offers crucial performance insights, tracking metrics like accuracy and response times to ensure optimal efficiency. It facilitates cost management through efficiency optimization and enhances reliability tracking to ensure consistent performance. Additionally, monitoring refines user interactions and supports continuous improvement by adapting AI behavior based on user feedback and operational data, ultimately enhancing user satisfaction and operational efficiency.
How can organizations get started with building AI solutions using ZBrain?
To initiate AI development with ZBrain, organizations should contact ZBrain via email at hello@zbrain.ai or through the inquiry form on their website at https://zbrain.ai. The ZBrain team will assess your current AI infrastructure and needs, and help design a customized strategy that includes setup, integration, and comprehensive support to ensure successful implementation and maximization of AI capabilities within your business operations.
Insights

Solution architecture best practices: A guide for enterprise teams
The architecture design process culminates in a set of documented artifacts that communicate the solution to development, operations, and business teams.

Common solution architecture design challenges — and how to overcome them
Solution architecture must evolve from fragmented documentation practices to a structured, collaborative, and continuously validated design capability.
Why structured architecture design is the foundation of scalable enterprise systems
Structured architecture design guides enterprises from requirements to build-ready blueprints. Learn key principles, scalability gains, and TechBrain’s approach.
A guide to intranet search engine
Effective intranet search is a cornerstone of the modern digital workplace, enabling employees to find trusted information quickly and work with greater confidence.

Enterprise knowledge management guide
Enterprise knowledge management enables organizations to capture, organize, and activate knowledge across systems, teams, and workflows—ensuring the right information reaches the right people at the right time.
Company knowledge base: Why it matters and how it is evolving
A centralized company knowledge base is no longer a “nice-to-have” – it’s essential infrastructure. A knowledge base serves as a single source of truth: a unified repository where documentation, FAQs, manuals, project notes, institutional knowledge, and expert insights can reside and be easily accessed.
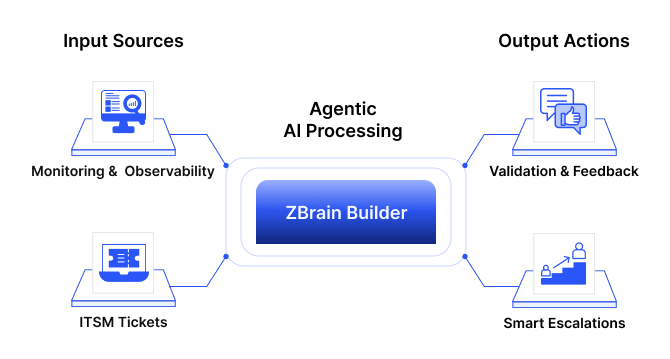
How agentic AI and intelligent ITSM are redefining IT operations management
Agentic AI marks the next major evolution in enterprise automation, moving beyond systems that merely respond to commands toward AI that can perceive, reason, act and improve autonomously.
What is an enterprise search engine? A guide to AI-powered information access
An enterprise search engine is a specialized software that enables users to securely search and retrieve information from across an organization’s internal data sources and systems.
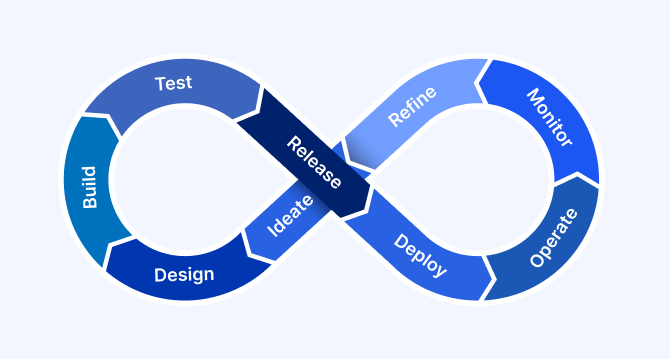
A comprehensive guide to AgentOps: Scope, core practices, key challenges, trends, and ZBrain implementation
AgentOps (agent operations) is the emerging discipline that defines how organizations build, observe and manage the lifecycle of autonomous AI agents.